Greenhouse gases trap heat and make the
planet warmer. Human activities are responsible for almost all of the
increase in greenhouse gases in the atmosphere over the last 150
years.1
The largest source of greenhouse gas emissions from human activities
in the United States is from burning fossil fuels for electricity,
heat, and transportation.
EPA tracks total U.S. emissions by
publishing the
Inventory of U.S. Greenhouse Gas Emissions and Sinks.
This annual report estimates the total national greenhouse gas
emissions and removals associated with human activities across the
United States.
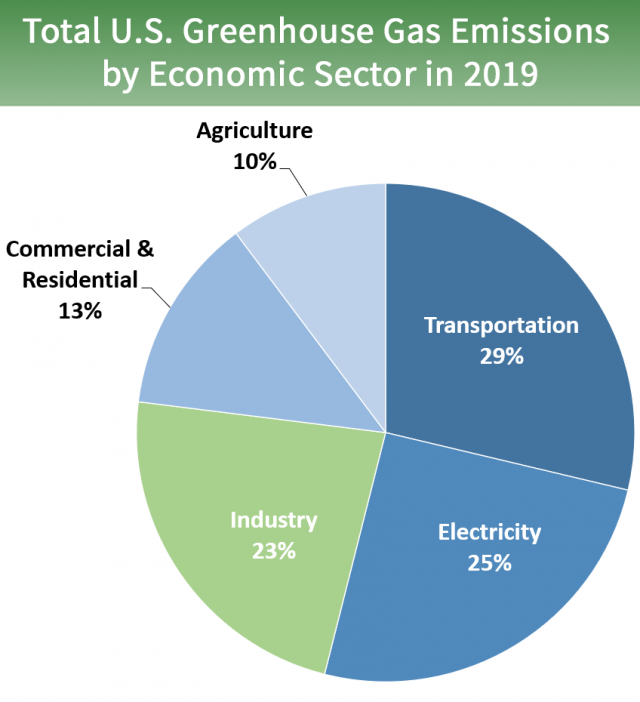
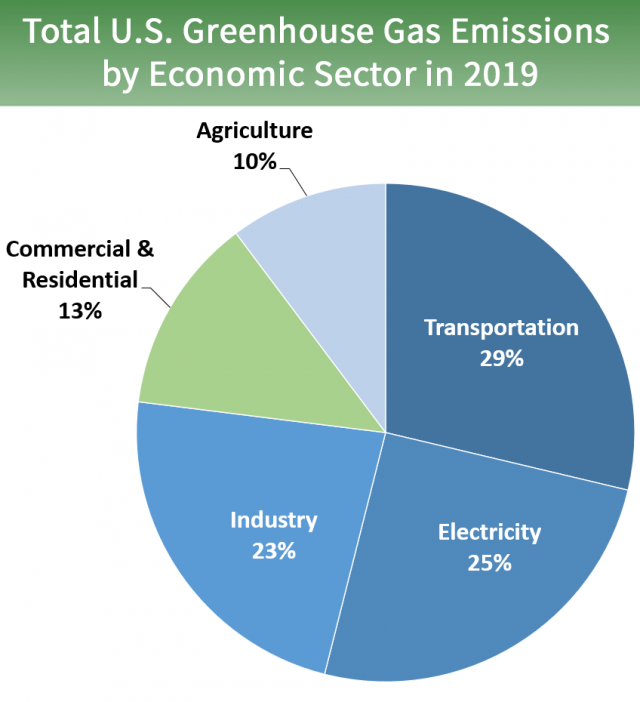
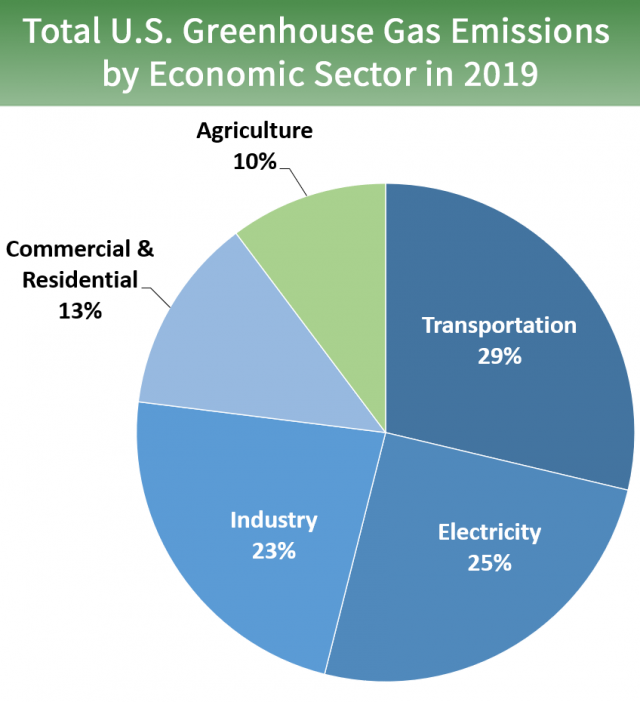
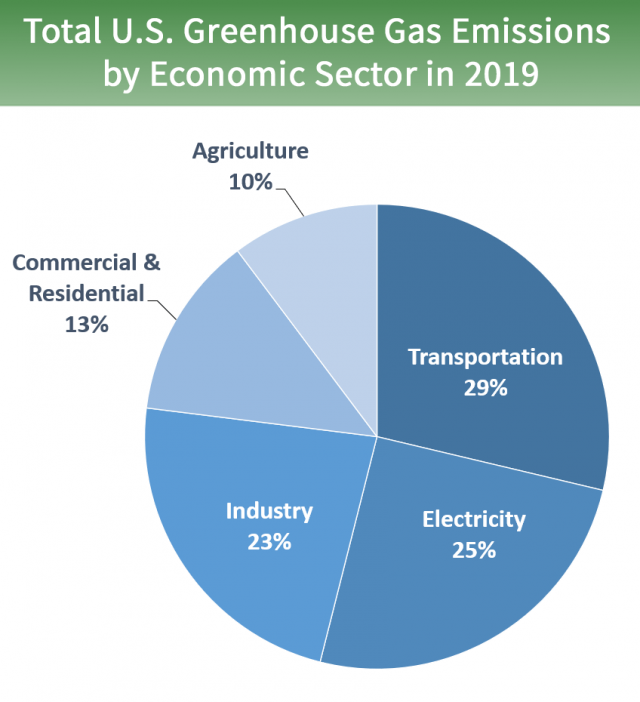
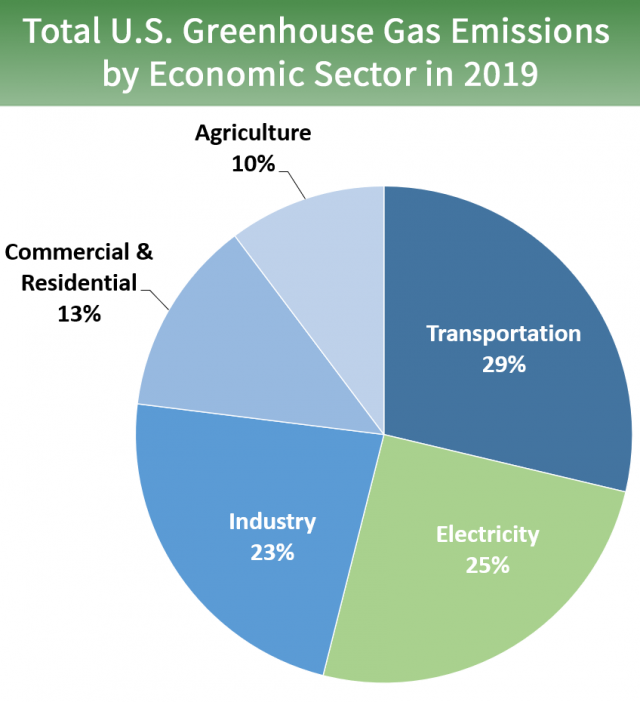
The primary sources of greenhouse gas
emissions in the United States are:
Transportation (29 percent of 2019 greenhouse gas
emissions) The transportation sector generates the largest share
of greenhouse gas emissions. Greenhouse gas emissions from
transportation primarily come from burning fossil fuel for our cars,
trucks, ships, trains, and planes. Over 90 percent of the fuel used
for transportation is petroleum based, which includes primarily
gasoline and diesel.2
Electricity production (25 percent of 2019 greenhouse gas
emissions) Electricity production generates the second largest
share of greenhouse gas emissions. Approximately 62 percent of our
electricity comes from burning fossil fuels, mostly coal and natural
gas.3
Industry (23 percent of 2019 greenhouse gas emissions)
Greenhouse gas emissions from industry primarily come from burning
fossil fuels for energy, as well as greenhouse gas emissions from
certain chemical reactions necessary to produce goods from raw
materials.
Commercial and Residential (13 percent of 2019 greenhouse
gas emissions) Greenhouse gas emissions from businesses and homes
arise primarily from fossil fuels burned for heat, the use of
certain products that contain greenhouse gases, and the handling of
waste.
Agriculture (10 percent of 2019 greenhouse gas emissions)
Greenhouse gas emissions from agriculture come from livestock such
as cows, agricultural soils, and rice production.
Land Use and Forestry (12 percent of 2019 greenhouse gas
emissions) Land areas can act as a sink (absorbing CO2
from the atmosphere) or a source of greenhouse gas emissions. In the
United States, since 1990, managed forests and other lands are a net
sink, i.e., they have absorbed more CO2 from the
atmosphere than they emit.
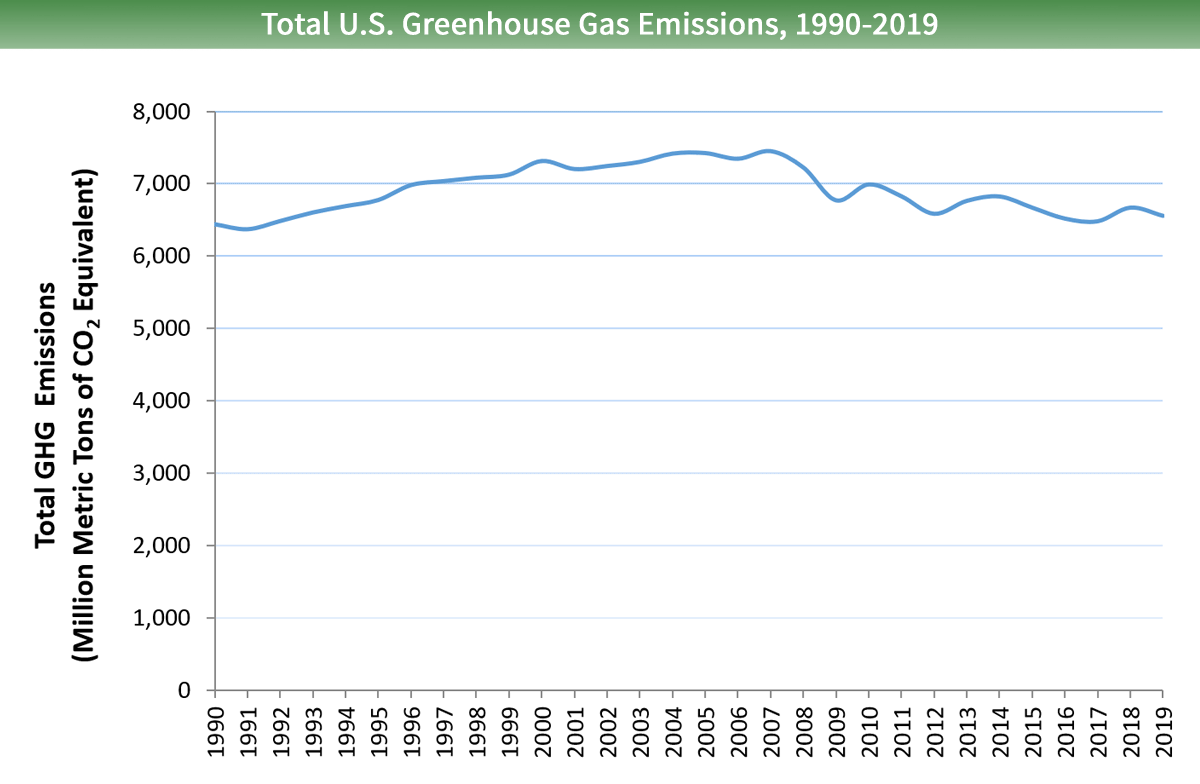
Emissions and Trends
Since 1990, gross U.S. greenhouse gas
emissions have increased by 2 percent. From year to year, emissions
can rise and fall due to changes in the economy, the price of fuel,
and other factors. In 2019, U.S. greenhouse gas emissions decreased
compared to 2018 levels. The decrease was primarily in CO2
emissions from fossil fuel combustion which was a result of multiple
factors, including a decrease in total energy use and a continued
shift from coal to less carbon intensive natural gas and renewables.
IPCC (2007). Climate Change 2007: Mitigation. (PDF)Exit
Exit EPA website(863 pp,
24MB)Contribution of Working Group III to the Fourth
Assessment Report of the Intergovernmental Panel on Climate Change
[B. Metz, O.R. Davidson, P.R. Bosch, R. Dave, L.A. Meyer (eds)],
Cambridge University Press, Cambridge, United Kingdom and New
York, NY, USA.
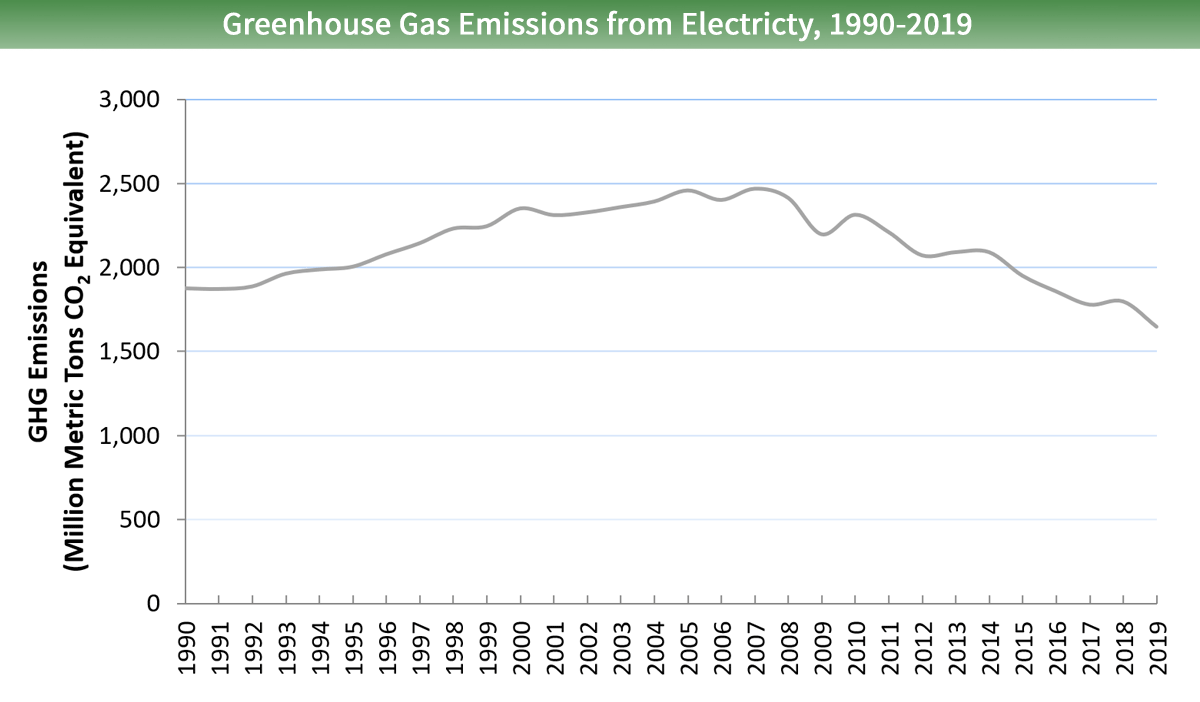
The Electricity sector
involves the generation, transmission, and distribution of
electricity.
Carbon dioxide (CO2) makes up the vast majority of
greenhouse gas emissions from the sector, but smaller amounts of
methane (CH4) and
nitrous oxide (N2O) are also emitted.
These gases are released during the combustion of fossil fuels, such
as coal, oil, and natural gas, to produce electricity. Less than 1
percent of greenhouse gas emissions from the sector come from
sulfur hexafluoride (SF6), an insulating chemical used
in electricity transmission and distribution equipment.
* Land Use, Land-Use Change, and Forestry in the United States is a
net sink and removes approximately 12 percent of these greenhouse gas
emissions, this net sink is not shown in the above diagram. All
emission estimates from the
Inventory of U.S. Greenhouse Gas Emissions and Sinks: 19902019.
Emissions and Trends
In 2019, the
electricity sector was the second largest source of U.S. greenhouse
gas emissions, accounting for 25 percent of the U.S. total. Greenhouse
gas emissions from electricity have decreased by about 12 percent
since 1990 due to a shift in generation to lower- and non-emitting
sources of electricity generation and an increase in end-use energy
efficiency.
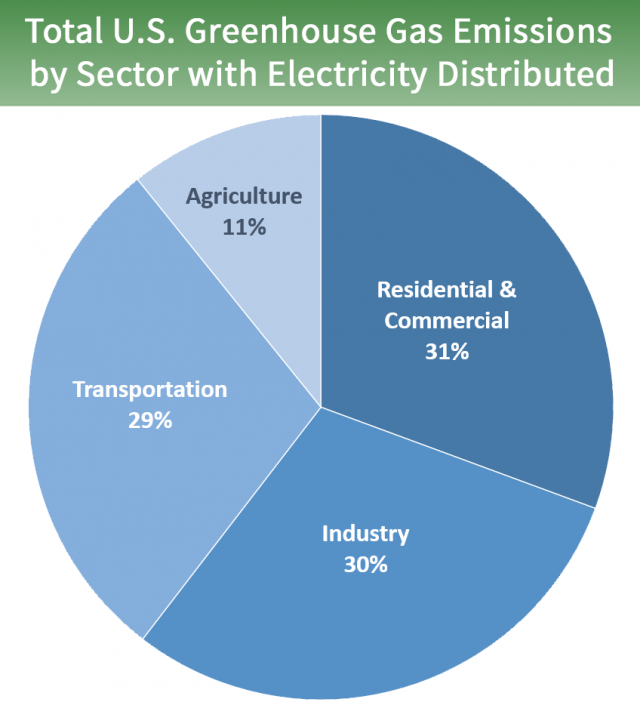
Electricity is used by other sectorsin
homes, businesses, and factories. Therefore, it is possible to
attribute the greenhouse gas emissions from electricity generation to
the sectors that use the electricity. Looking at greenhouse gas
emissions by end-use sector can help us understand energy demand
across sectors and changes in energy use over time.
When emissions from electricity
generation are allocated to the industrial end-use sector, industrial
activities account for a much larger share of U.S. greenhouse gas
emissions. Greenhouse gas emissions from commercial and residential
buildings also increase substantially when emissions from electricity
end-use are included, due to the relatively large share of electricity
use (e.g., heating, ventilation, and air conditioning; lighting; and
appliances) in these sectors. The transportation sector currently has
a relatively low percentage of electricity use but it is growing due
to the use of electric and plug-in vehicles.
Example Reduction Opportunities
for the Electricity Sector
Type
How Emissions Are
Reduced
Examples
Increased Efficiency of Fossil-fired Power Plants and Fuel
Switching
Increasing the efficiency of existing fossil fuel-fired power
plants by using advanced technologies; substituting less
carbon-intensive fuels; shifting generation from higher-emitting
to lower-emitting power plants.
Converting a coal-fired
boiler to use of natural gas, or co-firing natural gas.
Converting a single-cycle
gas turbine into a combined-cycle turbine.
Shifting dispatch of
electric generators to lower-emitting units or power plants.
Renewable Energy
Using
renewable energy sources rather than fossil fuel to generate
electricity.
Increasing the share of total electricity generated from wind,
solar, hydro, and geothermal sources, as well as certain biofuel
sources, through the addition of new renewable energy generating
capacity.
Increased End-Use Energy Efficiency
Reducing electricity use and peak demand by increasing energy
efficiency and conservation in homes, businesses, and industry.
EPA's
ENERGY STARÛ
partners avoided over 330 million metric tons of greenhouse gases
in 2018 alone, helped Americans save over $35 billion in energy
costs, and reduced electricity use by 430 billion kWh.
Nuclear Energy
Generating electricity from nuclear energy rather than the
combustion of fossil fuels.
Extending the life of existing nuclear plants and building new
nuclear generating capacity.
Carbon Capture and Sequestration (CCS)
Capturing CO2 as a byproduct of fossil fuel combustion
before it enters the atmosphere, transporting the CO2,
injecting the CO2 deep underground at a carefully
selected and suitable subsurface geologic formation where it is
securely stored.
Capturing CO2 from the stacks of a coal-fired power
plant and then transferring the CO2 via pipeline,
injecting the CO2 deep underground at a carefully
selected and suitable nearby abandoned oil field where it is
securely stored.
Learn more about CCS.
IPCC (2014).
Climate Change 2014: Mitigation of Climate Change (PDF)Exit
Exit EPA website(1454
pp, 50MB). Contribution of Working Group III to the Fifth
Assessment Report of the Intergovernmental Panel on Climate Change [Edenhofer,
O., R. Pichs-Madruga, Y. Sokona, E. Farahani, S. Kadner, K. Seyboth,
A. Adler, I. Baum, S. Brunner, P. Eickemeier, B. Kriemann, J.
Savolainen, S. Schl—mer, C. von Stechow, T. Zwickel and J.C. Minx
(eds.)]. Cambridge University Press, Cambridge, United Kingdom and
New York, NY, USA.
Transportation Sector Emissions
The Transportation sector
includes the movement of people and goods by cars, trucks, trains,
ships, airplanes, and other vehicles. The majority of greenhouse gas
emissions from transportation are
carbon dioxide (CO2) emissions resulting from the
combustion of petroleum-based products, like gasoline, in internal
combustion engines. The largest sources of transportation-related
greenhouse gas emissions include passenger cars, medium- and
heavy-duty trucks, and light-duty trucks, including sport utility
vehicles, pickup trucks, and minivans. These sources account for over
half of the emissions from the transportation sector. The remaining
greenhouse gas emissions from the transportation sector come from
other modes of transportation, including commercial aircraft, ships,
boats, and trains, as well as pipelines and lubricants.
Relatively small amounts of
methane (CH4) and
nitrous oxide (N2O) are emitted during fuel combustion.
In addition, a small amount of
hydrofluorocarbon (HFC) emissions are included in the
Transportation sector. These emissions result from the use of mobile
air conditioners and refrigerated transport.
* Land Use, Land-Use Change, and Forestry in the United States is a
net sink and removes approximately 12 percent of these greenhouse gas
emissions, this net sink is not shown in the above diagram. All
emission estimates from the
Inventory of U.S. Greenhouse Gas Emissions and Sinks: 19902019.
Emissions and Trends
In 2019, greenhouse gas emissions from
transportation accounted for about 29 percent of total U.S. greenhouse
gas emissions, making it the largest contributor of U.S. greenhouse
gas emissions. In terms of the overall trend, from 1990 to 2019, total
transportation emissions have increased due, in large part, to
increased demand for travel. The number of vehicle miles traveled (VMT)
by light-duty motor vehicles (passenger cars and light-duty trucks)
increased by 48 percent from 1990 to 2019, as a result of a confluence
of factors including population growth, economic growth, urban sprawl,
and periods of low fuel prices. Between 1990 and 2004, average fuel
economy among new vehicles sold annually declined, as sales of
light-duty trucks increased. Starting in 2005, average new vehicle
fuel economy began to increase while light-duty VMT grew only modestly
for much of the period. Average new vehicle fuel economy has improved
almost every year since 2005 slowing the rate of increase of CO2
emissions, and the truck share is about 56 percent of new vehicles in
model year 2019.
Emissions
involved in the consumption of electricity for transportation
activities are included above, but not shown separately (as was done
for other sectors). These indirect emissions are negligible,
accounting for less than 1 percent of the total emissions shown in the
graph. All emission estimates from the
Inventory of U.S. Greenhouse Gas Emissions and Sinks: 19902019.
Examples of Reduction
Opportunities in the Transportation Sector
Type
How Emissions Are
Reduced
Examples
Fuel Switching
Using fuels that emit less CO2
than fuels currently being used. Alternative sources can include
biofuels; hydrogen; electricity from renewable sources, such as
wind and solar; or fossil fuels that are less CO2-intensive
than the fuels that they replace. Learn more about
Green Vehicles and Alternative and Renewable Fuels.
Using public buses that are fueled
by compressed natural gas rather than gasoline or diesel.
Using electric or hybrid
automobiles, provided that the energy is generated from
lower-carbon or non-fossil fuels.
Using renewable fuels such as
low-carbon biofuels.
Improving Fuel Efficiency with
Advanced Design, Materials, and Technologies
Using advanced technologies, design,
and materials to develop more fuel-efficient vehicles. Learn about
EPA's
vehicle greenhouse gas rules.
Developing advanced vehicle
technologies such as hybrid vehicles and electric vehicles, that
can store energy from braking and use it for power later.
Reducing the weight of materials
used to build vehicles.
Reducing the aerodynamic
resistance of vehicles through better shape design.
Driving sensibly (avoiding rapid
acceleration and braking, observing the speed limit).
Reducing engine-idling.
Improved voyage planning for
ships, such as through improved weather routing, to increase
fuel efficiency.
Reducing Travel Demand
Employing urban planning to reduce
the number of miles that people drive each day. Reducing the need
for driving through travel efficiency measures such as commuter,
biking, and pedestrian programs. Learn about EPA's
Smart Growth Program.
Building public transportation,
sidewalks, and bike paths to increase lower-emission
transportation choices.
Zoning for mixed use areas, so
that residences, schools, stores, and businesses are close
together, reducing the need for driving.
References
IPCC (2014).
Climate Change 2014: Mitigation of Climate Change (PDF)Exit
Exit EPA website(1454
pp, 50 MB). Contribution of Working Group III to the Fifth
Assessment Report of the Intergovernmental Panel on Climate Change [Edenhofer,
O., R. Pichs-Madruga, Y. Sokona, E. Farahani, S. Kadner, K. Seyboth,
A. Adler, I. Baum, S. Brunner, P. Eickemeier, B. Kriemann, J.
Savolainen, S. Schl—mer, C. von Stechow, T. Zwickel and J.C. Minx
(eds.)]. Cambridge University Press, Cambridge, United Kingdom and New
York, NY, USA.
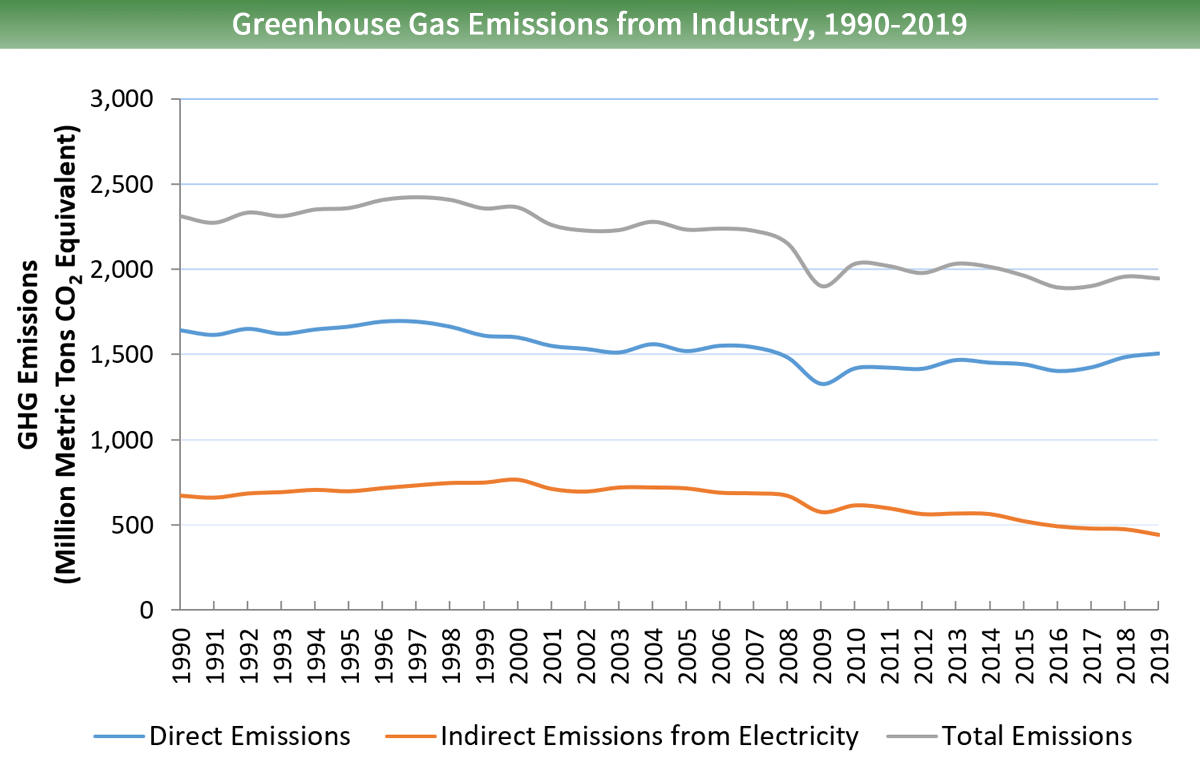
Industry Sector Emissions
The Industry sector produces the goods
and raw materials we use every day. The greenhouse gases emitted
during industrial production are split into two categories:
direct emissions that are produced at the facility, and
indirect emissions that occur off site, but are
associated with the facility's use of electricity.
Direct emissions are
produced by burning fuel for power or heat, through chemical
reactions, and from leaks from industrial processes or equipment. Most
direct emissions come from the consumption of fossil fuels for energy.
A smaller amount of direct emissions, roughly one third, come from
leaks from natural gas and petroleum systems, the use of fuels in
production (e.g., petroleum products used to make plastics), and
chemical reactions during the production of chemicals, iron and steel,
and cement.
Indirect emissions are
produced by burning fossil fuel at a power plant to make electricity,
which is then used by an industrial facility to power industrial
buildings and machinery.
In 2019, direct industrial greenhouse gas
emissions accounted for 23 percent of total U.S. greenhouse gas
emissions, making it the third largest contributor to U.S. greenhouse
gas emissions, after the
Transportation and
Electricity sectors. Including both direct emissions and indirect
emissions associated with electricity use, industry's share of total
U.S. greenhouse gas emissions in 2019 was 30 percent, making it the
largest contributor of greenhouse gases of any sector. Total U.S.
greenhouse gas emissions from industry, including electricity, have
declined by 16 percent since 1990.
Examples of Reduction
Opportunities for the Industry Sector
Type
How Emissions Are Reduced
Examples
Energy Efficiency
Upgrading to more efficient
industrial technology. EPA's
ENERGY STARÛ program helps industries become more
energy-efficient.
Identifying the ways that
manufacturers can use less energy to light and heat factories
or to run equipment.
Fuel Switching
Switching to fuels that result in
less CO2 emissions but the same amount of energy, when
combusted.
Using natural gas instead of coal to
run machinery.
Recycling
Producing industrial products from
materials that are recycled or renewable, rather than producing
new products from raw materials.
Using scrap steel and scrap aluminum
as opposed to smelting new aluminum or forging new steel.
Training and Awareness
Making companies and workers aware
of the steps to reduce or prevent emissions leaks from equipment.
EPA has a variety of voluntary programs that provide resources for
training and other steps for reducing emissions. EPA supports
programs for the
aluminum,
semiconductor, and
magnesium industries.
Instituting handling policies and
procedures for perfluorocarbons (PFCs), hydrofluorocarbons (HFCs),
and sulfur hexafluoride (SF6) that reduce occurrences
of accidental releases and leaks from containers and equipment.
References
IPCC (2014).
Climate Change 2014: Mitigation of Climate Change (PDF)Exit
Exit EPA website(1454 pp, 50
MB). Contribution of Working Group III to the Fifth Assessment
Report of the Intergovernmental Panel on Climate Change [Edenhofer,
O., R. Pichs-Madruga, Y. Sokona, E. Farahani, S. Kadner, K. Seyboth,
A. Adler, I. Baum, S. Brunner, P. Eickemeier, B. Kriemann, J.
Savolainen, S. Schl—mer, C. von Stechow, T. Zwickel and J.C. Minx
(eds.)]. Cambridge University Press, Cambridge, United Kingdom and New
York, NY, USA.
Commercial and Residential
Sector Emissions
The residential and commercial sectors
include all homes and commercial businesses (excluding agricultural
and industrial activities). Greenhouse gas emissions from this sector
come from direct emissions including fossil fuel
combustion for heating and cooking needs, management of waste and
wastewater, and leaks from refrigerants in homes and businesses as
well as indirect emissions that occur offsite but are
associated with use of electricity consumed by homes and businesses.
Direct emissions are
produced from residential and commercial activities in a variety of
ways:
Combustion of natural gas and
petroleum products for heating and cooking needs emits
carbon dioxide (CO2),
methane (CH4), and
nitrous oxide (N2O). Emissions from natural gas
consumption represent 80 percent of the direct fossil fuel CO2
emissions from the residential and commercial sectors in 2019. Coal
consumption is a minor component of energy use in both of these
sectors.
Organic waste sent to landfills emits
CH4.
Wastewater treatment plants emit CH4
and N2O.
Anaerobic digestion at biogas
facilities emits CH4.
Fluorinated gases (mainly hydrofluorocarbons, or HFCs) used in
air conditioning and refrigeration systems can be released during
servicing or from leaking equipment.
* Land Use, Land-Use Change, and Forestry in the United States is a
net sink and removes approximately 12 percent of these greenhouse
gas emissions, this net sink is not shown in the above diagram. All
emission estimates from the
Inventory of U.S. Greenhouse Gas Emissions and Sinks: 19902019.
Indirect emissions are
produced by burning fossil fuel at a power plant to make electricity,
which is then used in residential and commercial activities such as
lighting and for appliances.
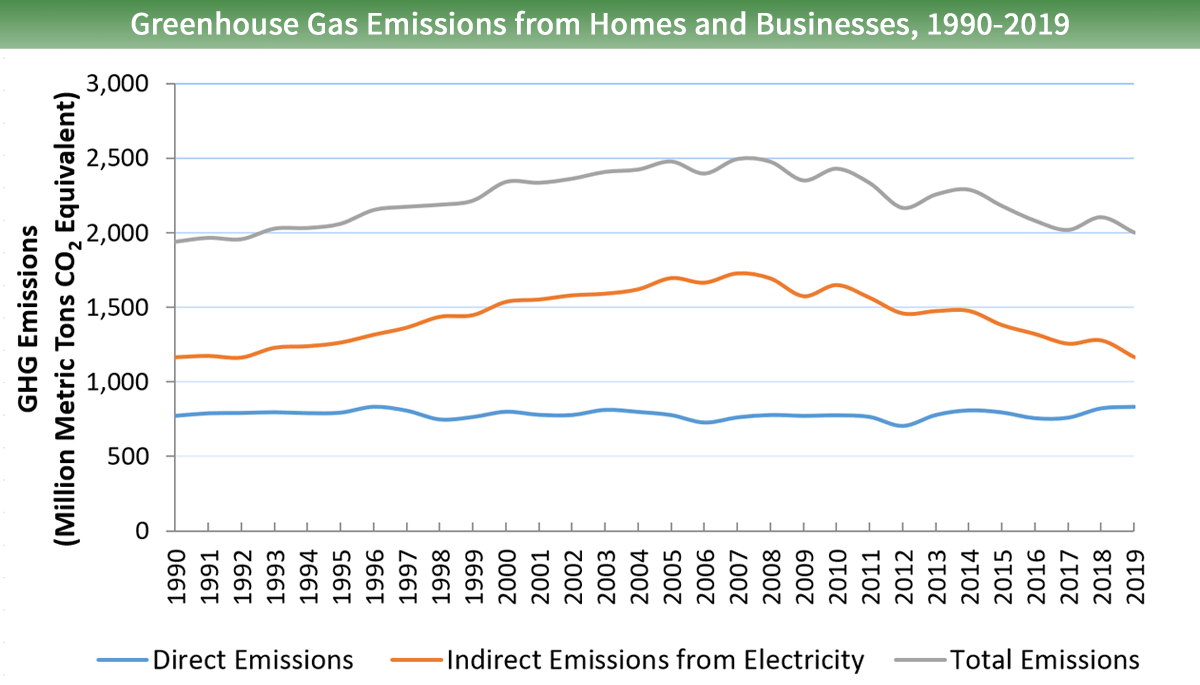
In 2019, direct greenhouse gas emissions
from homes and businesses accounted for 13 percent of total U.S.
greenhouse gas emissions. Greenhouse gas emissions from homes and
businesses vary from year to year often correlated with seasonal
fluctuations in energy use caused primarily by weather conditions.
Total residential and commercial greenhouse gas emissions, including
direct and indirect emissions, in 2019 have increased by 3 percent
since 1990. Greenhouse gas emissions from on-site direct emissions in
homes and businesses have increased by 8 percent since 1990.
Additionally, indirect emissions from electricity use by homes and
businesses increased from 1990 to 2007, but have decreased since then
to approximately 1990 levels in 2019.
Examples of Reduction
Opportunities in the Residential and Commercial Sector
Type
How Emissions Are
Reduced
Examples
Homes and Commercial Buildings
Reducing energy use through energy
efficiency.
Homes and commercial buildings use
large amounts of energy for heating, cooling, lighting, and
other functions. "Green building" techniques and retrofits can
allow new and existing buildings to use less energy to
accomplish the same functions, leading to fewer greenhouse gas
emissions. Techniques to improve building energy efficiency
include better insulation; more energy-efficient heating,
cooling, ventilation, and refrigeration systems; efficient
fluorescent lighting; passive heating and lighting to take
advantage of sunlight; and the purchase of energy-efficient
appliances and electronics. Learn more about
ENERGY STARÛ.
Wastewater Treatment
Making water and wastewater
systems more energy-efficient.
Drinking water and wastewater
systems account for approximately 2 percent of energy use in the
United States. By incorporating energy efficiency practices into
their water and wastewater plant, municipalities and utilities
can save 15 to 30 percent in energy use. Learn more about
Energy Efficiency for Water and Wastewater Utilities.
Waste Management
Reducing solid waste sent to
landfills. Capturing and using methane produced in current
landfills.
Landfill gas is the natural
byproduct of the decomposition of solid waste in landfills. It
primarily consists of CO2 and CH4. Well
established, low-cost methods to reduce greenhouse gases from
consumer waste exist, including recycling programs, waste
reduction programs, and landfill methane capture programs.
Reducing leakage from air
conditioning and refrigeration equipment. Using refrigerants
with lower global warming potentials.
Commonly used refrigerants in
homes and businesses include ozone-depleting
hydrochlorofluorocarbon (HCFC) refrigerants, often HCFC-22, and
blends consisting entirely or primarily of hydrofluorocarbons (HFCs),
both of which are potent greenhouse gases. In recent years there
have been several advancements in air conditioning and
refrigeration technology that can help food retailers reduce
both refrigerant charges and refrigerant emissions. Learn more
about EPA's GreenChill
Program to reduce greenhouse gas emissions from
supermarkets.
Agriculture Sector Emissions
Agricultural activities crop and
livestock production for food contribute to emissions in a variety
of ways:
Various management practices on
agricultural soils can lead to increased availability of nitrogen in
the soil and result in emissions of
nitrous oxide (N2O). Specific activities that
contribute to N2O emissions from agricultural lands
include the application of synthetic and organic fertilizers, the
growth of nitrogen-fixing crops, the drainage of organic soils, and
irrigation practices. Management of agricultural soils accounts for
just over half of the greenhouse gas emissions from the Agriculture
economic sector.*
Livestock, especially ruminants such
as cattle, produce
methane (CH4) as part of their normal digestive
processes. This process is called enteric fermentation, and it
represents over a quarter of the emissions from the Agriculture
economic sector.
The way in which manure from livestock
is managed also contributes to CH4 and N2O
emissions. Different manure treatment and storage methods affect how
much of these greenhouse gases are produced. Manure management
accounts for about 12 percent of the total greenhouse gas emissions
from the Agriculture economic sector in the United States.
Smaller sources of
agricultural emissions include CO2 from liming and urea
application, CH4 from rice cultivation, and burning crop
residues, which produces CH4 and N2O.
* Land Use, Land-Use Change, and Forestry in the United States is a
net sink and removes approximately 12 percent of these greenhouse
gas emissions, this net sink is not shown in the above diagram. All
emission estimates from the
Inventory of U.S. Greenhouse Gas Emissions and Sinks: 19902019.
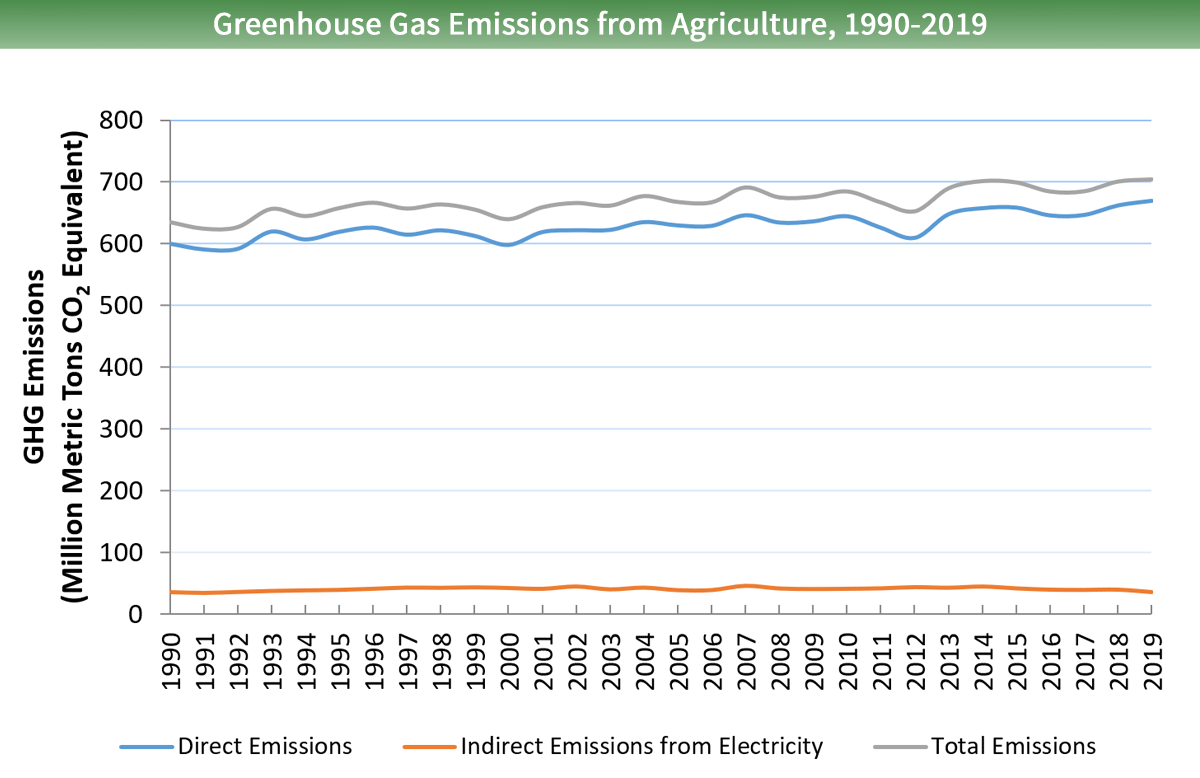
In 2019, greenhouse gas emissions from
the agriculture economic sector accounted for 10 percent of total U.S.
greenhouse gas emissions. Greenhouse gas emissions from agriculture
have increased by 12 percent since 1990. Drivers for this increase
include a 9 percent increase in N2O from management of
soils, along with a 60 percent growth in combined CH4 and N2O
emissions from livestock manure management systems, reflecting the
increased use of emission-intensive liquid systems over this time
period. Emissions from other agricultural sources have generally
remained flat or changed by a relatively small amount since 1990.
Examples of Reduction
Opportunities for the Agriculture Sector
Type
How Emissions Are
Reduced
Examples
Land and Crop Management
Adjusting the methods for managing
land and growing crops.
Fertilizing crops with the
appropriate amount of nitrogen required for optimal crop
production, since over-application of nitrogen can lead to
higher nitrous oxide emissions without enhancing crop
production.
Draining water from wetland rice
soils during the growing season to reduce methane emissions.
Livestock Management
Adjusting feeding practices and
other management methods to reduce the amount of methane
resulting from enteric fermentation.
Improving pasture quality to
increase animal productivity, which can reduce the amount of
methane emitted per unit of animal product. Also, increased
productivity in livestock can be introduced through improved
breeding practices.
Manure Management
Controlling the way in which
manure decomposes to reduce nitrous oxide and methane
emissions.
Capturing methane from manure
decomposition to produce renewable energy.
Handling manure as a solid or
depositing it on pasture rather than storing it in a
liquid-based system such as a lagoon would likely reduce
methane emissions but may increase nitrous oxide emissions.
Storing manure in anaerobic
lagoons to maximize methane production and then capturing the
methane to use as an energy substitute for fossil fuels.
For more information on
capturing methane from manure management systems, see EPA's
AgSTAR Program, a
voluntary outreach and education program that promotes
recovery and use of methane from animal manure.
Land Use, Land-Use Change,
and Forestry Sector Emissions and Sequestration
Plants absorb
carbon dioxide (CO2) from the atmosphere as they
grow, and they store some of this carbon as aboveground and
belowground biomass throughout their lifetime. Soils and dead
organic matter/litter can also store some of the carbon from these
plants depending on how the soil is managed and other environmental
conditions (e.g., climate). This storage of carbon in plants, dead
organic matter/litter and soils is called biological carbon
sequestration. Because biological sequestration takes CO2
out of the atmosphere and stores it in these carbon pools, it is
also called a carbon "sink."
Emissions or sequestration of CO2,
as well as emissions of CH4 and N2O can occur
from management of lands in their current use or as lands are
converted to other land uses. Carbon dioxide is exchanged between
the atmosphere and the plants and soils on land, for example, as
cropland is converted into grassland, as lands are cultivated for
crops, or as forests grow. In addition, using biological feedstocks
(such as energy crops or wood) for purposes such as electricity
generation, as inputs to processes that create liquid fuels, or as
building materials can lead to emissions or sequestration.*
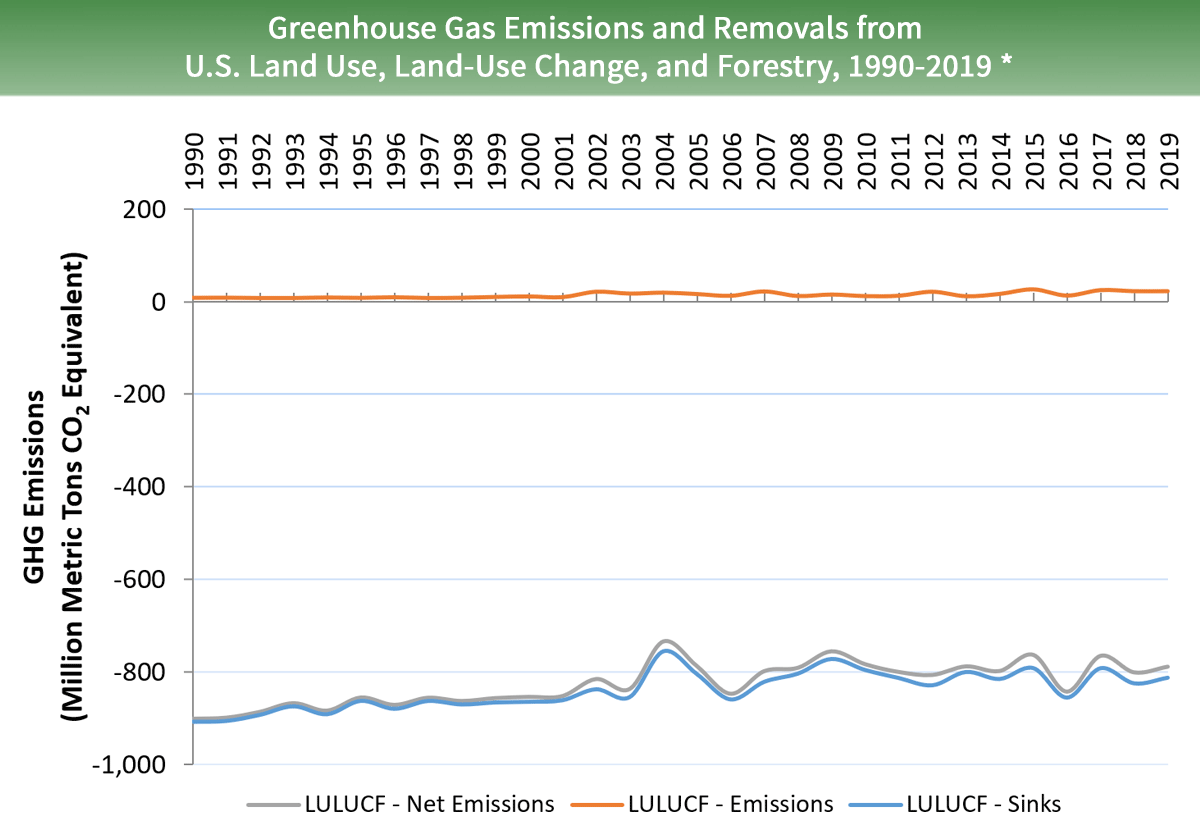
In the United States overall, since
1990, Land Use, Land-Use Change, and Forestry (LULUCF) activities
have resulted in more removal of CO2 from the atmosphere
than emissions. Because of this, the LULUCF sector in the United
States is considered a net sink, rather than a source, of CO2
over this time-period. In many areas of the world, the opposite is
true, particularly in countries where large areas of forest land are
cleared, often for conversion to agricultural purposes or for
settlements. In these situations, the LULUCF sector can be a net
source of greenhouse gas emissions.
* Emissions and sequestration of CO2
are presented under the
Land Use, Land-Use Change, and Forestry sector in the Inventory.
Emissions of methane (CH4) and nitrous oxide (N2O)
also occur as a result of land use and management activities in the
LULUCF sector. Other emissions from CH4 and N2O
are also presented in the Energy sector.
Emissions and Trends
In 2019, the net CO2
removed from the atmosphere from the LULUCF sector was 12 percent of
total U.S. greenhouse gas emissions. Between 1990 and 2019, total
carbon sequestration in the LULUCF sector decreased by 11 percent,
primarily due to a decrease in the rate of net carbon accumulation
in forests and cropland, as well as an increase in CO2
emissions from urbanization. Additionally, while episodic in nature,
increased CO2, CH4 and N2O
emissions from forest fires have also occurred over the time series.
*Note: The LULUCF sector is a
net "sink" of emissions in the United States (e.g., more greenhouse
gas emissions are sequestered than emitted from land use activities),
so net greenhouse gas emissions from LULUCF are negative. All emission
estimates from the
Inventory of U.S. Greenhouse Gas Emissions and Sinks: 19902019.
Reducing Emissions and
Enhancing Sinks from Land Use, Land-Use Change, and Forestry

 Sources of Greenhouse Gas Emissions
 These gases are released during the combustion of fossil fuels, such
as coal, oil, and natural gas, to produce electricity. Less than 1
percent of greenhouse gas emissions from the sector come from
These gases are released during the combustion of fossil fuels, such
as coal, oil, and natural gas, to produce electricity. Less than 1
percent of greenhouse gas emissions from the sector come from