|

07 April
2023
Master Plan Part 3
Sustainable Energy for All of Earth
Published on April 5, 2023
Acknowledgements
We appreciate the many prior studies that have pushed
the topic of a sustainable energy economy
forward, the work of the International
Energy Agency (IEA), U.S. Energy Information Administration (EIA),
U.S. Department of Energy National Laboratories, and the input from
various non-Tesla affiliated advisors.
Tesla Contributors
Felix Maire
Matthew Fox
Mark Simons
Turner Caldwell
Alex Yoo
Eliah Gilfenbaum
Andrew Ulvestad
Tesla Advisors
Drew Baglino
Rohan Ma
Vineet Mehta
Executive Summary
On March 1, 2023, Tesla presented Master Plan Part 3 –
a proposed path to reach a sustainable global energy economy through
end-use electrification and sustainable electricity generation
and storage. This paper outlines the assumptions, sources and
calculations behind that proposal. Input and conversation are
welcome.
The analysis has three main components:
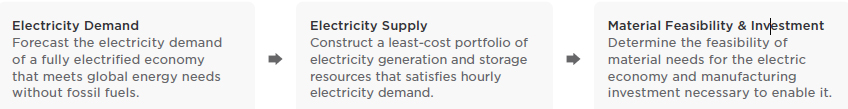
Figure 1: Process overview
This paper finds a sustainable energy economy is
technically feasible and requires less investment and less material
extraction
than continuing today’s unsustainable energy economy. While many prior
studies have come to a similar conclusion, this study
seeks to push the thinking forward related to material intensity,
manufacturing capacity, and manufacturing investment required
for a transition across all energy sectors worldwide.

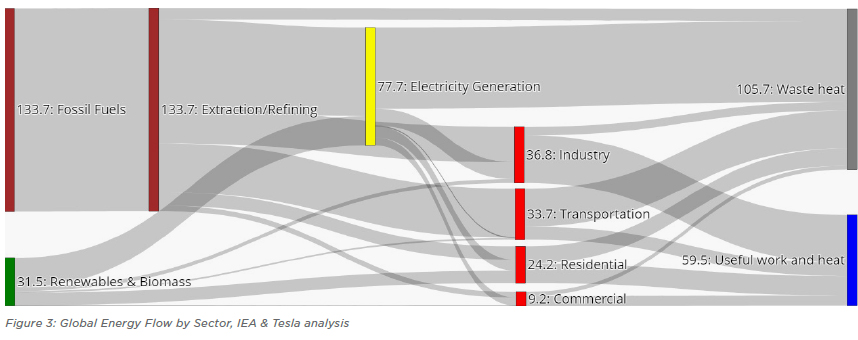
The Current Energy Economy is Wasteful
According to the International Energy Agency (IEA)
2019 World Energy Balances, the global primary energy supply is 165
PWh/
year, and total fossil fuel supply is 134PWh/year 1ab.
37% (61PWh) is consumed before making it to the end consumer. This
includes the fossil fuel industries’
self-consumption during extraction/refining, and transformation losses
during electricity generation. Another 27%
(44PWh) is lost by inefficient end-uses such as internal combustion
engine vehicles and natural gas furnaces. In
total, only 36% (59PWh) of the primary energy supply produces useful
work or heat for the economy. Analysis from Lawrence
Livermore National Lab shows similar levels of inefficiency for
the global and US energy supply2,3.
Today’s Energy Economy (PWh/year)
a The 2021 and 2022 IEA World Energy Balances were not
complete at the time of this work, and the 2020 dataset showed a
decrease in energy consumption from 2019,
which likely was pandemic-related and inconsistent with energy
consumption trends.
b Excluded certain fuel supplies used for non-energy purposes, such as
fossil fuels used in plastics manufacturing.
The Plan to Eliminate Fossil Fuels
In an electrified economy with sustainably generated
energy, most of the upstream losses associated with mining, refining
and
burning fuels to create electricity are eliminated, as are the
downstream losses associated with non-electric end-uses. Some
industrial processes will require more energy input (producing green
hydrogen for example), and some mining and refining
activity needs to increase (related to metals for batteries, solar
panels, wind turbines, etc.)
The following 6 steps show the actions needed to fully
electrify the economy and eliminate fossil fuel use. The 6 steps
detail the
electricity demand assumptions for the sustainable energy economy and
leads to the electricity demand curve that is modeled.
Modeling was done on the US energy economy using
high-fidelity data available from the Energy Information
Administration
(EIA) from 2019-2022c, and results were scaled to estimate actions
needed for the global economy using a 6x scaling factor
based on the 2019 energy consumption scalar between the U.S. and the
world, according to IEA Energy Balances. This is a
significant simplification and could be an area for improvement in
future analyses, as global energy demands are different from
the U.S. in their composition and expected to increase over time. This
analysis was conducted on the U.S. due to availability of
high-fidelity hourly data.
This plan considers onshore/offshore wind, solar,
existing nuclear and hydro as sustainable electricity generation
sources, and
considers existing biomass as sustainable although it will likely be
phased out over time. Additionally, this plan does not address
sequestering carbon dioxide emitted over the past century of fossil
fuel combustion, beyond the direct air capture required for
synthetic fuel generation; any future implementation of such
technologies would likely increase global energy demand.
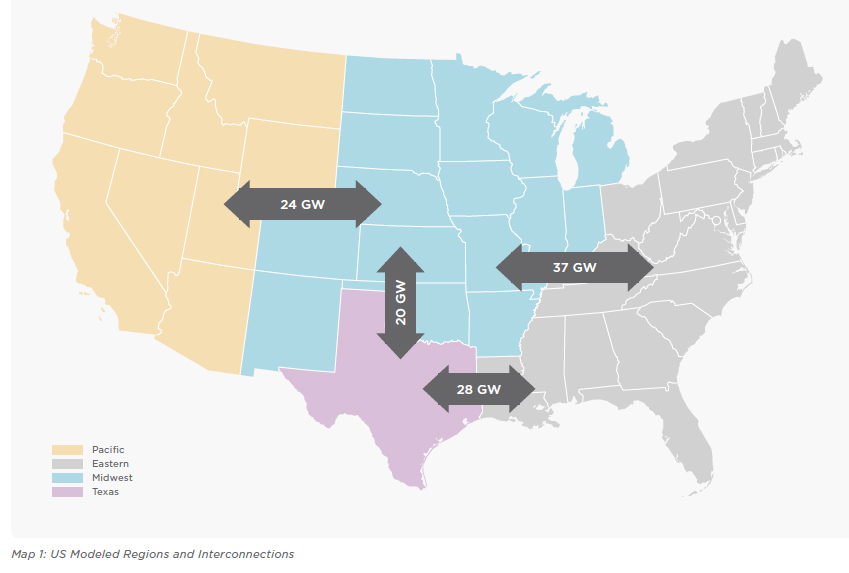
01 Repower the Existing Grid with Renewables
The existing US hourly electricity demand is modeled
as an inflexible baseline demand taken from the EIA 4.
Four US sub-regions
(Texas, Pacific, Midwest, Eastern) are modeled to account for regional
variations in demand, renewable resource availability,
weather, and grid transmission constraints. This existing electrical
demand is the baseline load that must be supported by
sustainable generation and storage.
Globally, 65PWh/year of primary energy is supplied to
the electricity sector, including 46PWh/year of fossil fuels; however
only
26PWh/year of electricity is produced, due to inefficiencies
transforming fossil fuels into electricityd. If the grid were instead
renewably powered, only 26PWh/year of sustainable generation would be
required.
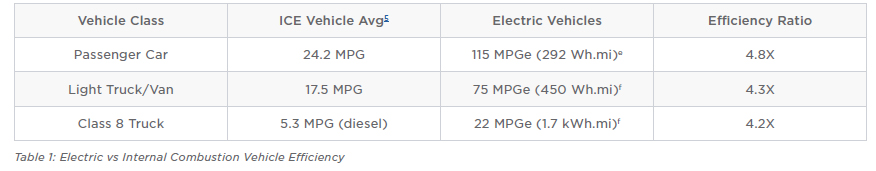
02 Switch to Electric Vehicles
Electric vehicles are approximately 4x more efficient
than internal combustion engine vehicles due to higher powertrain
efficiency, regenerative braking capability, and optimized platform
design. This ratio holds true across passenger vehicles, lightduty
trucks, and Class 8 semis as shown in the Table 1.
c US hourly time series data used as model inputs are
available at https://www.eia.gov/opendata/browser/ for download.
d Embedded in the 26 PWh/year is 3.5 PWh/year of useful heat, mostly
produced in co-generation power stations, which generate heat and
power electricity.
e Tesla’s global fleet average energy efficiency including Model 3, Y,
S and X
f Tesla’s internal estimate based on industry knowledge
The Plan to Eliminate Fossil Fuels
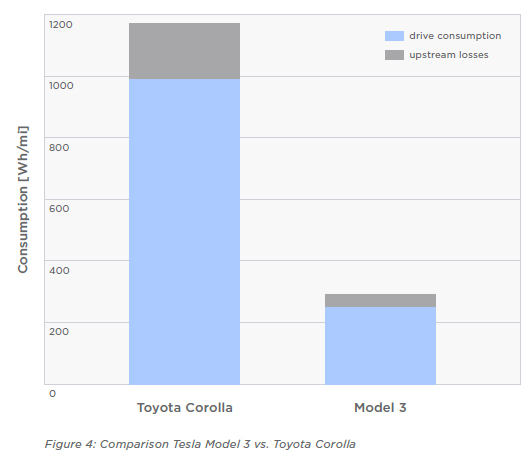
As a specific example, Tesla’s Model 3 energy
consumption is 131MPGe vs. a Toyota Corolla with 34MPG 6,7,
or 3.9x lower,
and the ratio increases when accounting for upstream losses such as
the energy consumption related extracting and refining
fuel (See Figure 4).
To establish the electricity demand of an electrified
transportation sector, historical monthly US transportation petroleum
usage,
excluding aviation and ocean shipping, for each sub-region is scaled
by the EV efficiency factor above (4x) 8.
Tesla’s hour by
hour vehicle fleet charging behavior, split between inflexible and
flexible portions, is assumed as the EV charging load curve in
the 100% electrified transportation sector. Supercharging, commercial
vehicle charging, and vehicles with <50% state of charge
are considered inflexible demand. Home and workplace AC charging are
flexible demand and modeled with a 72-hour energy
conservation constraint, modeling the fact that most drivers have
flexibility to charge when renewable resources are abundant.
On average, Tesla drivers charge once every 1.7 days from 60% SOC to
90% SOC, so EVs have sufficient range relative to typical
daily mileage to optimize their charging around renewable power
availability provided there is charging infrastructure at both
homes and workplaces.
Global electrification of the transportation sector
eliminates 28 PWh/year of fossil fuel use and, applying the 4x EV
efficiency
factor, creates ~7 PWh/year of additional electrical demand.
The Plan to Eliminate Fossil Fuels
03 Switch to Heat Pumps in Residential, Business &
Industry
Heat pumps move heat from source to sink via the
compression/expansion of an intermediate refrigerant9.
With the appropriate
selection of refrigerants, heat pump technology applies to space
heating, water heating and laundry driers in residential and
commercial buildings, in addition to many industrial processes.

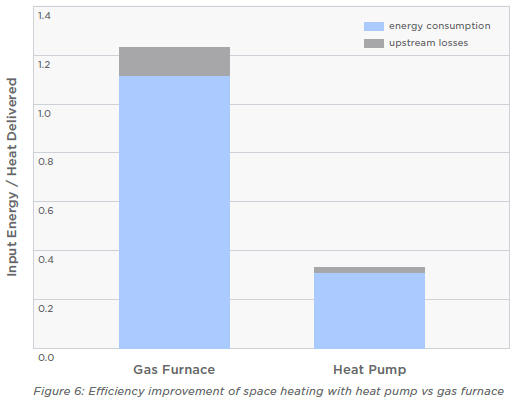
Air source heat pumps are the most suitable technology
for retrofitting gas furnaces in existing homes, and can deliver 2.8
units
of heat per unit of energy consumed based on a heating seasonal
performance factor (HSPF) of 9.5 Btu/Wh, a typical efficiency
rating for heat-pumps today 11.
Gas furnaces create heat by burning natural gas. They have an annual
fuel utilization efficiency
(AFUE) of ~90%12.
Therefore, heat pumps use ~3x less energy than gas furnaces (2.8/0.9).
Residential and Commercial Sectors
The EIA provides historical monthly US natural gas
usage for the residential and commercial sectors in each sub-region 8.
The 3x
heat-pump efficiency factor reduces the energy demand if all gas
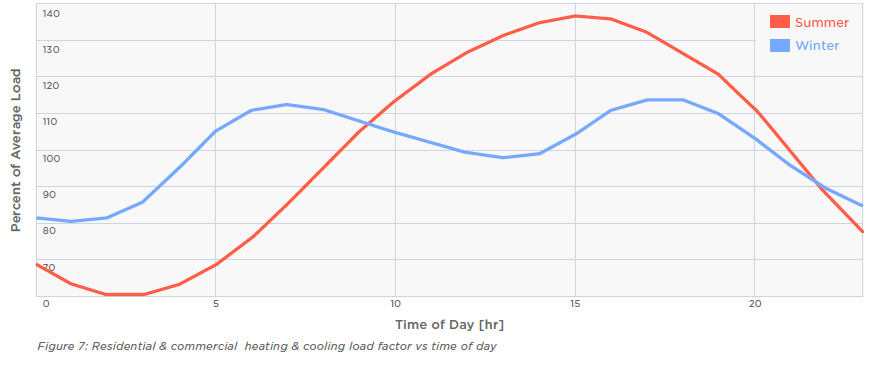
appliances are electrified. The hourly load factor of baseline
electricity demand was applied to estimate the hourly electricity
demand variation from heat pumps, effectively ascribing
heating demand to those hours when homes are actively being heated or
cooled. In summer, the residential/commercial demand
peaks mid-afternoon when cooling loads are highest, in winter demand
follows the well-known “duck-curve” which peaks in
morning & evening.
Global electrification of residential and commercial
appliances with heat pumps eliminates 18 PWh/year of fossil fuel and
creates
6PWh/year of additional electrical demand.
Industrial Sector
Industrial processes up to ~200C, such as food, paper,
textile and wood industries can also benefit from the efficiency gains
offered by heat pumps 13,
although heat pump efficiency decreases with higher temperature
differentials. Heat pump integration
is nuanced and exact efficiencies depend heavily on the temperature of
the heat source the system is drawing from (temperature
rise is key in determining factor for heat pump efficiency), as such
simplified assumptions for achievable COP by temperature
range are used:
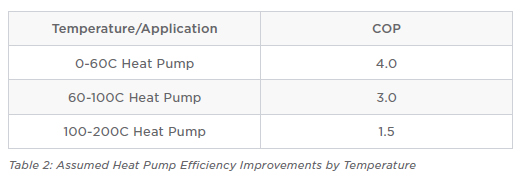
Based on the temperature make-up of industrial heat
according to the IEA and the assumed heat pump efficiency by
temperature in Table 2, the weighted industrial heat pump efficiency
factor modeled is 2.2 14,15,16.
The EIA provides historical monthly fossil fuel usage
for the industrial sector for each sub-region 8.
All industrial fossil fuel use,
excluding embedded fossil fuels in products (rubber, lubricants,
others) is assumed to be used for process heat. According to
the IEA, 45% of process heat is below 200C, and when electrified with
heat pumps requires 2.2x less input energy16.
The added
industrial heat-pump electrical demand was modeled as an inflexible,
flat hourly demand.
Global electrification of industrial process heat
<200C with heat pumps eliminates 12PWh/year of fossil fuels and
creates
5PWh/year of additional electrical demand.
04 Electrify High Temperature Heat Delivery and
Hydrogen Production
Electrify High Heat Industrial Processes
Industrial processes that require high temperatures (>200C), account
for the remaining 55% of fossil fuel use and require special
consideration. This includes steel, chemical, fertilizer and cement
production, among others.
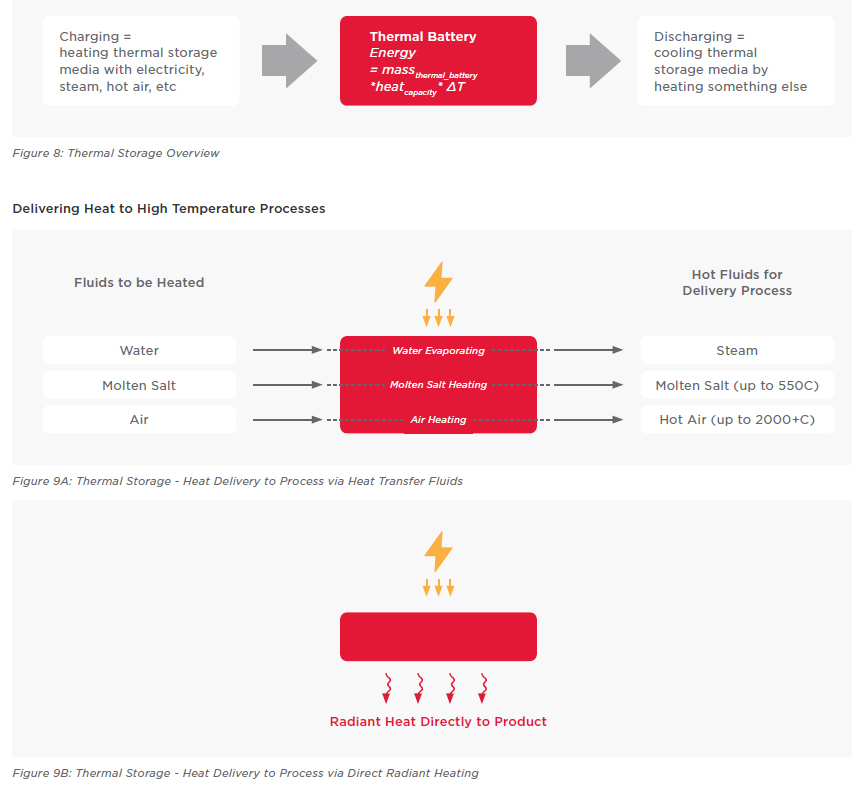
These high-temperature industrial processes can be
serviced directly by electric resistance heating, electric arc
furnaces or
buffered through thermal storage to take advantage of low-cost
renewable energy when it is available in excess. On-site thermal
storage may be valuable to cost effectively accelerate industrial
electrification (e.g., directly using the thermal storage media and
radiative heating elements) 17,18.
Identify the optimal thermal storage media by
temperature/application
Electric resistance heating, and electric arc
furnaces, have similar efficiency to blast furnace heating, therefore
will require a
similar amount of renewable primary energy input. These
high-temperature processes are modeled as an inflexible, flat demand.
Thermal storage is modeled as an energy buffer for
high-temperature process heat in the industrial sector, with a round
trip
thermal efficiency of 95%. In regions with high solar installed
capacity, thermal storage will tend to charge midday and discharge
during the nights to meet continuous 24/7 industrial thermal needs.
Figure 9 shows possible heat carriers and illustrates that
several materials are candidates for providing process heat >1500C.
Global electrification of industrial process heat
>200C eliminates 9PWh/year of fossil fuel fuels and creates 9PWh/year
of
additional electrical demand, as equal heat delivery efficiency is
assumed.
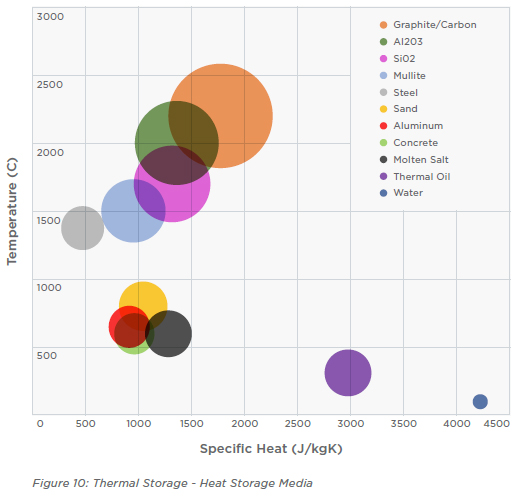
Note: Bubble diameters represent specific heat over usable range.
Sustainably Produce Hydrogen for Steel and
Fertilizer
Today hydrogen is produced from coal, oil and natural gas, and is used
in the refining of fossil fuels (notably diesel) and in
various industrial applications (including steel and fertilizer
production).
Green hydrogen can be produced via the electrolysis of
water (high energy intensity, no carbon containing products consumed/
produced) or via methane pyrolysis (lower energy intensity, produces a
solid carbon-black byproduct that could be converted
into useful carbon-based products)g.
To conservatively estimate electricity demand for
green hydrogen, the assumption is:
• No hydrogen will be needed for fossil fuel refining going forward
• Steel production will be converted to the Direct Reduced Iron
process, requiring hydrogen as an input. Hydrogen demand to
reduce iron ore (assumed to be Fe3O4) is based on the following
reduction reaction:
Reduction by H2
• Fe3O4 + H2 = 3FeO + H2O
• FeO + H2 = Fe + H2O
• All global hydrogen production will come from
electrolysis
g Sustainable steel production may also be performed
through molten oxide electrolysis, which requires heat and
electricity, but does not require hydrogen as a reducing
agent, and may be less energy intensive, but this benefit is
beyond the scope of the analysis19.
These simplified assumptions for industrial demand,
result in a global demand of 150Mt/yr of green hydrogen, and sourcing
this
from electrolysis requires an estimated ~7.2PWh/year
of sustainably generated electricityh,20,21.
The electrical demand for hydrogen production is
modeled as a flexible load with annual production constraints, with
hydrogen
storage potential modeled in the form of underground
gas storage facilities (like natural gas is stored today) with maximum
resource constraints. Underground gas storage
facilities used today for natural gas storage can be retrofitted for
hydrogen
storage; the modeled U.S. hydrogen storage requires
~30% of existing U.S. underground gas storage facilities22,23.
Note that some
storage facilities, such as salt caverns, are not
evenly geographically dispersed which may present challenges, and
there may be
better alternative storage solutions.
Global sustainable green hydrogen eliminates 6 PWh/year
of fossil fuel energy use, and 2 PWh/year of non-energy usei,24.
The
fossil fuels are replaced by 7PWh/year of additional electrical
demand.
05 Sustainably Fuel Planes & Boats
Both continental and intercontinental ocean shipping
can be electrified by optimizing design speed and routes to enable
smaller
batteries with more frequent charge stops on long routes. According to
the IEA, ocean shipping consumes 3.2PWh/year globally.
By applying an estimated 1.5x electrification efficiency advantage, a
fully-electrified global shipping fleet will consume 2.1PWh/
year of electricity 25.
Short distance flights can also be electrified through
optimized aircraft design and flight trajectory at today’s battery
energy
densities 26.
Longer distance flights, estimated as 80% of air travel energy
consumption (85B gallons/year of jet fuel globally),
can be powered by synthetic fuels generated from excess
renewable electricity leveraging the Fischer-Tropsch process, which
uses a mixture of carbon monoxide (CO) and hydrogen (H2) to synthesize
a wide variety of liquid hydrocarbons, and has been
demonstrated as a viable pathway for synthetic jet fuel synthesis27.
This requires an additional 5PWh/year of electricity, with:
- H2 generated from electrolysis 21
- CO2 captured via direct air capture 28,
29
- CO produced via electrolysis of CO2
Carbon and hydrogen for synthetic fuels may also be
sourced from biomass. More efficient and cost-effective methods for
synthetic fuel generation may become available in time, and higher
energy density batteries will enable longer-distance aircraft
to be electrified thus decreasing the need for synthetic fuels.
The electrical demand for synthetic fuel production
was modeled as a flexible demand with an annual energy constraint.
Storage
of synthetic fuel is possible with conventional fuel storage
technologies, a 1:1 volume ratio is assumed. The electrical demand for
ocean shipping was modeled as a constant hourly demand.
Global sustainable synthetic fuel and electricity for boats and planes
eliminates 7PWh/year of fossil fuels, and creates 7PWh/year
of additional global electrical demand.
06 Manufacture the Sustainable Energy Economy
Additional electricity is required to build the generation and storage
portfolio - solar panels, wind turbines and
batteries - required for the sustainable energy economy. This
electricity demand was modeled as an incremental,
inflexible, flat hourly demand in the industrial sector. More
details can be found in the Appendix: Build the Sustainable Energy
Economy - Energy Intensity.
h Adjusted current demand for hydrogen, removing
demand related to oil refining, as that will not be required. Assumed
all of the hydrogen produced from coal and
natural gas today is replaced. Then, the energy required to produce
the hydrogen from coal and natural gas, compared to electrolysis, is
calculated.
i According to the IEA, 85% of natural gas non-energy consumption is
consumed by fertilizer and methanol production
Modeling the Fully Sustainable Energy Economy
These 6 steps create a U.S. electrical demand to be
fulfilled with sustainable generation and storage. To do so, the
generation and storage portfolio is
established using an hourly cost-optimal integrated capacity expansion
and dispatch modelj. The model is split
between four sub-regions of the US with transmission constraints
modeled between regions and run over four weatheryears
(2019-2022) to capture a range of weather conditionsk.
Interregional transmission limits are estimated based on the current
line capacity ratings on major transmission paths published by
North American Electricity Reliability Council (NERC) Regional
Entities (SERC30,
WECC31,
ERCOT32).
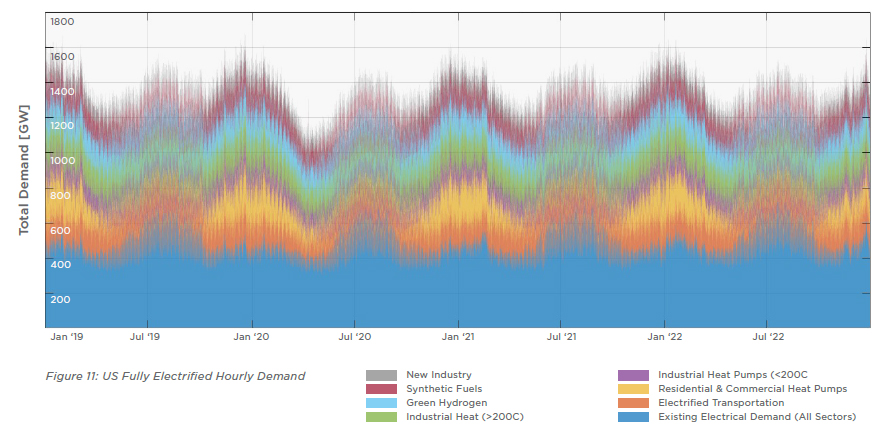
Figure 11 shows the fully electrified economy energy demand for the
full US.
Modeled Regions and Grid Interconnections
j Convex optimization models that can determine
optimal capacity expansion and resource dispatch are widely used
within the industry. For instance, by utilities or
system operators to plan their systems (e.g., generation and
grid investments required to meet their expected load), or to assess
the impact of specific energy policies on
the energy system. This model builds the least-cost generation and
storage portfolio to meet demand every hour of the four-year period
analyzed and dispatches that portfolio every
hour to meet demand. The capacity expansion and dispatch decisions are
optimized in one step, which ensures the portfolio is optimal over the
period analyzed, storage value is fully reflected and the
impact of weather variability modeled. Other analyses typically model
capacity expansion and portfolio dispatch as
two separate steps. The capacity expansion decisions are made first
(e.g. how much generation and storage is estimated to be the
least-cost portfolio over the time horizon),
followed by separate dispatch modeling of the portfolio mix (e.g. how
much generation and storage should be dispatched in each hour to meet
demand with sufficient operating reserves).
The two-stage approach produces pseudo-optimal results, but allows
more computationally intensive models at each stage.
k The model is constrained to meet a 15% operating reserve margin
every hour to ensure this generation and storage portfolio is robust
to a range of weather and system conditions
beyond those explicitely modeled.
Modeling the Fully Sustainable Energy Economy
Wind and solar resources for each region are modeled
with their respective hourly capacity factor (i.e., how much
electricity is produced hourly per MW of
installed capacity), its interconnection cost and the maximum capacity
available for the model to build. The wind
and solar hourly capacity factors specific to each region were
estimated using historical wind/solar generation
taken from EIA in each region, thus capturing differences in
resource potential due to regional weather patternsl,m. Capacity
factors were scaled to represent forward looking trends based
on the recent Princeton Net-Zero America study33.
Figure 11 shows the hourly capacity factor
for wind & solar versus time for the full US. Table 3 shows the
average capacity factor and demand for each
region of the US.
l EIA does not report offshore wind production for the
period analyzed given the limited existing offshore wind installed
capacity. The offshore wind generation profile
was estimated by scaling the historical onshore wind generation
profile to the offshore wind capacity factor estimated by the
Princeton Net-Zero America study.
m Each region is modeled with two onshore wind and two solar resources
with different capacity factor, interconnection cost and maximum
potential. This accounts for the fact that
the most economic sites are typically built first and subsequent
projects typically have lower capacity factors and/or higher
interconnection cost as they may be farther
located from demand centers requiring more transmission or in
locations with higher cost land.

The model builds generation and storage based on
resource-specific cost and performance attributes, and a global
objective of minimizing the levelized cost
of energyn. The model assumes increased inter-regional transmission
capacitieso.
To provide reliable year-round power, it is
economically optimal to deploy excess solar and wind capacity, which
leads to curtailment. Curtailment will
happen when (1) solar and/or wind generation is higher than the
electricity demand in a region, (2) storage
is full and (3) there is no available transmission capacity to
transmit the excess generation to other regions. There is
an economic tradeoff between building excess renewable
generation capacity, building grid storage, or expanding transmission
capability. That tradeoff may evolve as grid storage
technologies mature, but with the assumptions modeled, the optimal
generation and storage portfolio resulted in 32% curtailment.
n Costs considered in the objective function:
levelized capex of new generation and storage with a 5% discount rate,
fixed and variable operational and maintenance
(O&M) costs.
o 37 GW of transmission capacity is modeled between the Midwest and
the East, 28 GW between Texas and the East, 24 GW between Pacific and
the Midwest and 20 GW between Texas and the
Midwest. This corresponds to ~3% of the modeled combined regional peak
load. E.g., the peak load of the combined East and Midwest regions
was ~1.2 TW, and the transmission capacity between Midwest and
the East modeled as 37 GW. Currently, the transmission capacity is <1%
of the combined regional peak loads (with
transmission to/from Texas the lowest). Higher transmission capacities
generally reduce the total generation and storage buildout, but there
is an economic tradeoff between building
more transmission and building more generation plus storage.
For context, curtailment already exists in markets
with high renewable energy penetration. In 2020, 19% of the wind
generation in Scotland was curtailed, and in 2022, 6% of solar
generation in California (CAISO) was curtailed due to operational
constraints, such as thermal generators’ inability to ramp down
below their minimum operating level, or local congestion on the
transmission system34,35.
The sustainable energy economy will have an abundance
of inexpensive energy for consumers able to use it during periods of
excess, which will impact how and when energy is used.
In Figure 12 below, hourly dispatch is depicted across
a sample of fall days, showing the role of each generation and storage
resource in balancing supply and demand, as well as the
concentration of economic curtailment in the middle of the day when
solar is abundant.

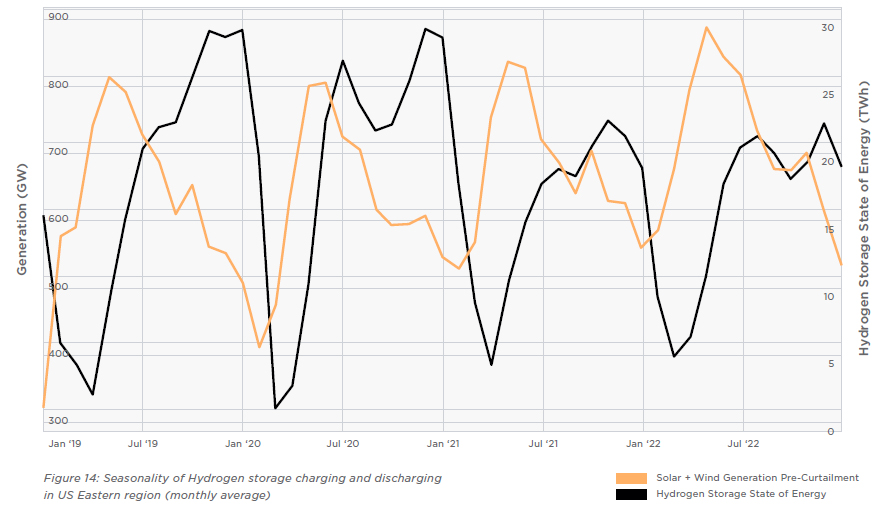
In Figure 14, hydrogen storage is generally filled
during the shoulder months (spring and fall) when electricity demand
is lower as heating and cooling seasons are
over, and solar and wind generation is relatively high. Similarly, as
excess generation declines in summer and
winter months, hydrogen reservoirs decline providing inter-seasonal
hydrogen storage.
Energy Storage Technologies Evaluated
For stationary applications, the energy storage
technologies in Table 4 below, which are currently deployed at scale,
are considered. Li-ion means
LiFePO4/Graphite lithium-ion batteries. A range of conservative future
installed costs are listed for lithium ion
given the volatility in commodities prices (especially lithium). While
there are other emerging technologies such as
metal-air (Fe <-> Fe2O3 redox couple) and Na-ion, these are not
commercially deployed and therefore not considered.
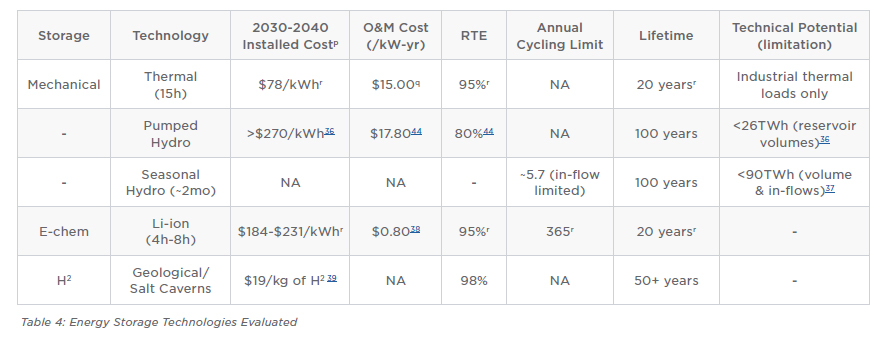
p This includes the storage equipment cost, balance of
system, interconnection and installation cost.
q Efficiency for the electricity to thermal conversion. The model does
not include generating electricity from heat.
Generation Technologies Evaluated
The Table below details all the generation
technologies considered in the sustainable energy economy. Installed
costs were taken from studies for 2030-2040
from NREL and the Princeton Net-Zero America study.
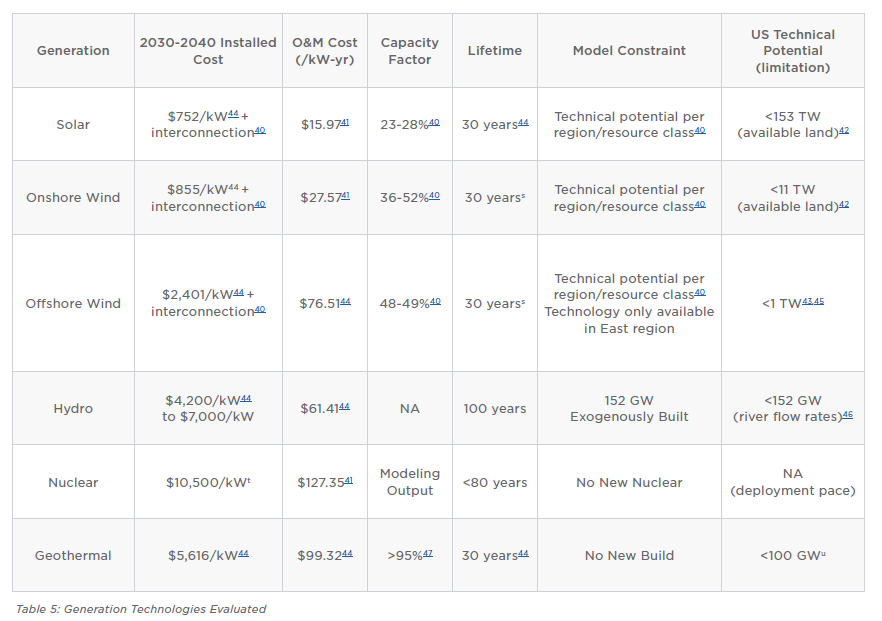
r Internal estimate.
s Assumed lifetime improvement. The NREL 2019 Cost of Wind Energy
Review estimates wind cost with 25-year lifetime as reference and
creates sensitivities with 30-year lifetime
t Assumed 50% higher capex than the EIA Cost and Performance
Characteristics of New Generating Technologies
u Excluding Deep Enhanced Geothermal System Resources
Model Results
US Only Model Results – Meeting New Electrification
Demand For the US, the optimal generation
and storage portfolio to meet the electricity demand, each hour, for
the years modeled is shown in the Table
below.
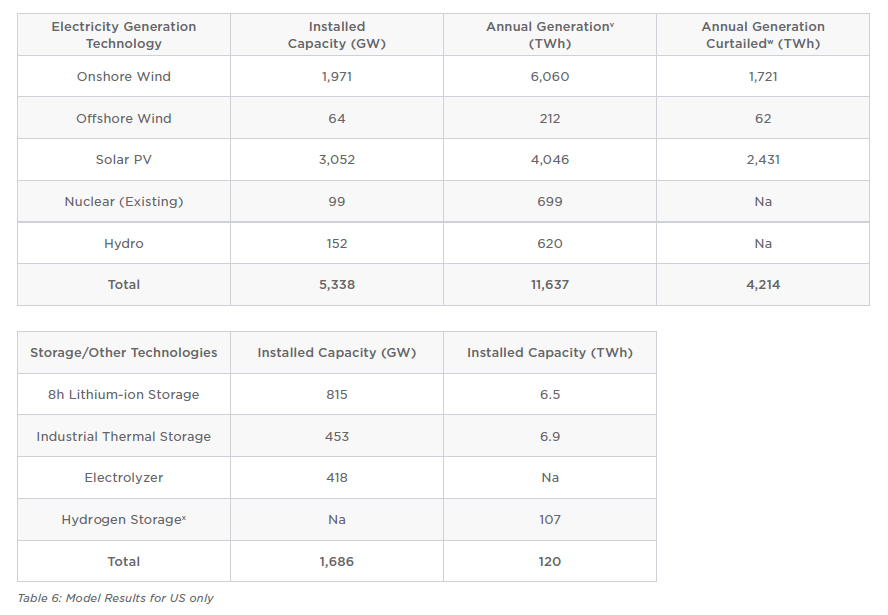
In addition, 1.2 TWh of distributed stationary
batteries are added based on incremental deployments of distributed
stationary storage alongside rooftop solar
at residential and commercial buildings. This includes storage
deployments at 15 million single-family
homes 48 with
rooftop solar, industrial storage paired with 43GW49,50
of commercial rooftop solar, and storage
replacement of at least 200GW51
of existing backup generator capacityy.
Distributed storage deployments are exogenous to
the model outputs given deployment driven by factors not fully
reflected in a least-cost model framework, including end-user
resiliency and self-sufficiency when storage is paired with
rooftop solar.
v After accounting for curtailment.
w The model curtails wind/solar generation when the electricity supply
is higher than the electricity demand and battery/thermal/hydrogen
storage are full already. Curtailed
wind/solar generation is generation that isn’t consumed by end-uses.
x 17.8 TWh of jet fuel derived from H2 are stored with current
infrastructure
y Solar and storage is deployed at less than one-third of suitable
residential buildings designated by NREL. Four hours of storage is
assumed for C&I deployment and for backup
generator substitution.
World Model Results – Meeting New Electrification Demand
Applying the 6 steps to the world’s energy flow would
displace all 125PWh/year of fossil fuels used for energy use and
replacethem with
66PWh/year of sustainably generated electricityz. An additional
4PWh/year of new industry is needed to manufacture
the required batteries, solar panels and wind turbines
(assumptions can be found in Appendix: Build the Sustainable Energy
Economy – Energy Intensity).
The global generation and storage portfolio to meet
the electricity demand was calculated by scaling the US resource mix
by 6x. As noted above, this is a significant
simplification and could be an area for improvement in future
analyses, as global energy demands are
different from the U.S. in their composition and expected to increase
over time. This analysis was conducted on the
U.S. due to availability of high-fidelity hourly data.
Sustainable Energy Economy [PWh/year]
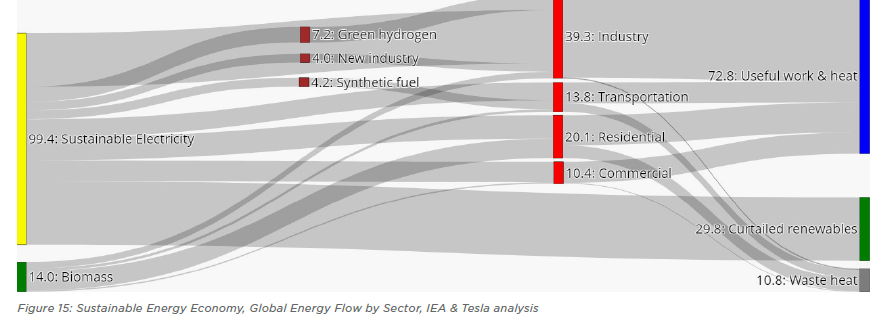
z Remaining ~9PWh/year of fossil fuels are consumed through
non-energy uses
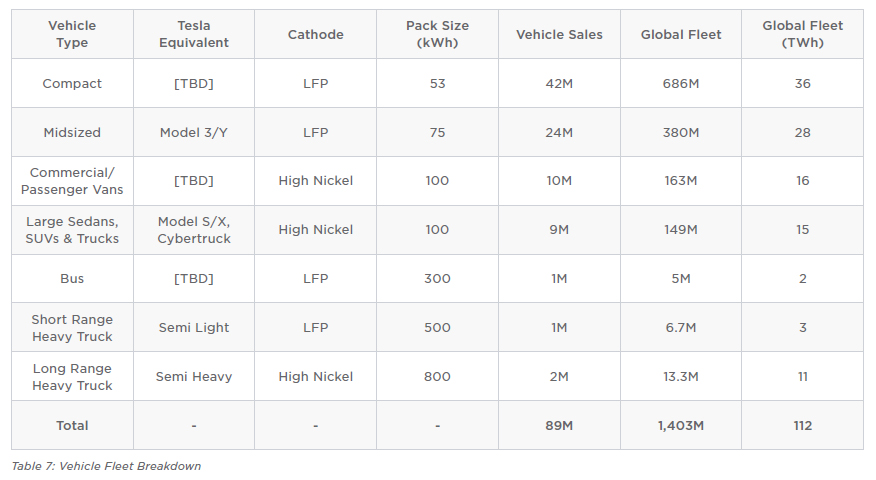
Batteries for Transportation
Vehicles
Today there are 1.4B vehicles globally and annual
passenger vehicle production of ~85M vehicles, according to OICA.
Based on pack size assumptions, the vehicle
fleet will require 112 TWh of batteriesaa. Autonomy has potential to
reduce the global fleet, and annual
production required, through improved vehicle utilization.
Standard-range vehicles can utilize the lower energy
density chemistries (LFP), whereas long-range vehicles require higher
energy density chemistries (high
nickel). Cathode assignment to vehicle segment is listed in the table
below. High Nickel refers to low to zero
cobalt Nickel Manganese cathodes currently in production, under
development at Tesla, Tesla’s suppliers and in
research groups.
aa To approximate the battery storage required to
displace 100% of road vehicles, the global fleet size, pack size
(kWh)/ Global passenger fleet size and annual
production (~85M vehicles/year) is based on data from OICA. The
number of vehicles by segment is estimated based on S&P Global sales
data. For buses and trucks, the US-to-global
fleet scalar of ~5x is used as global data was unavailable
Global Electric Fleet

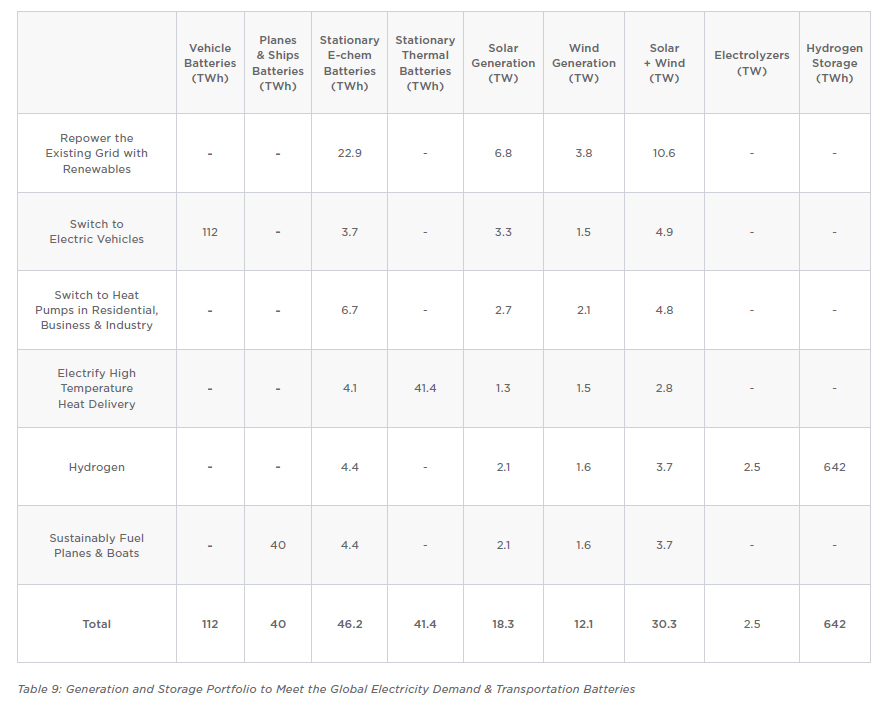
World Model Results – Electrification & Transportation Batteries
Table 9 summarizes the generation and storage
portfolio to meet the global electricity demand and the transportation
storage required based on the vehicle, ship
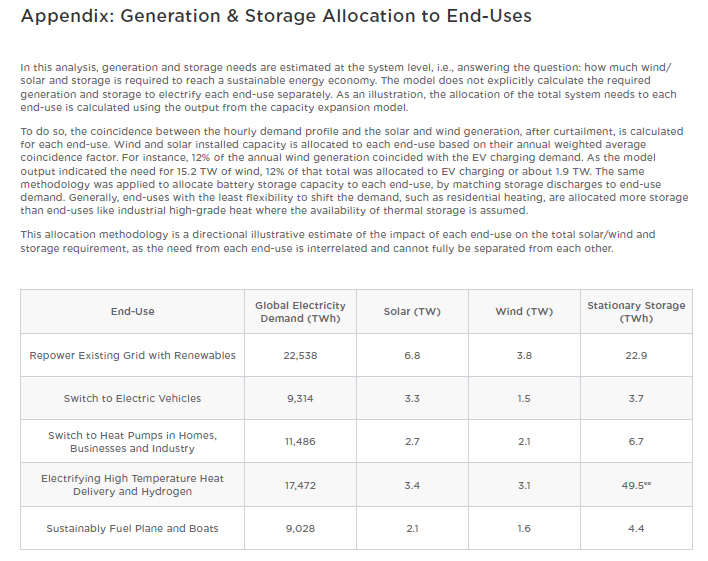
and plane assumptions. Explanation of how the generation and storage
portfolios were allocated to end-uses can be
found in Appendix: Generation and storage allocation to end-uses.
World Model Results – Electrification & Batteries for
Transportation

Investment Required
Investment catalogued here is inclusive of the
manufacturing facilities, mining and refining operations for materials
that require
significant growth, and hydrogen storage salt cavern installation.
Manufacturing facilities are sized to the replacement rate of
each asset, and upstream operations (e.g., mining) are sized
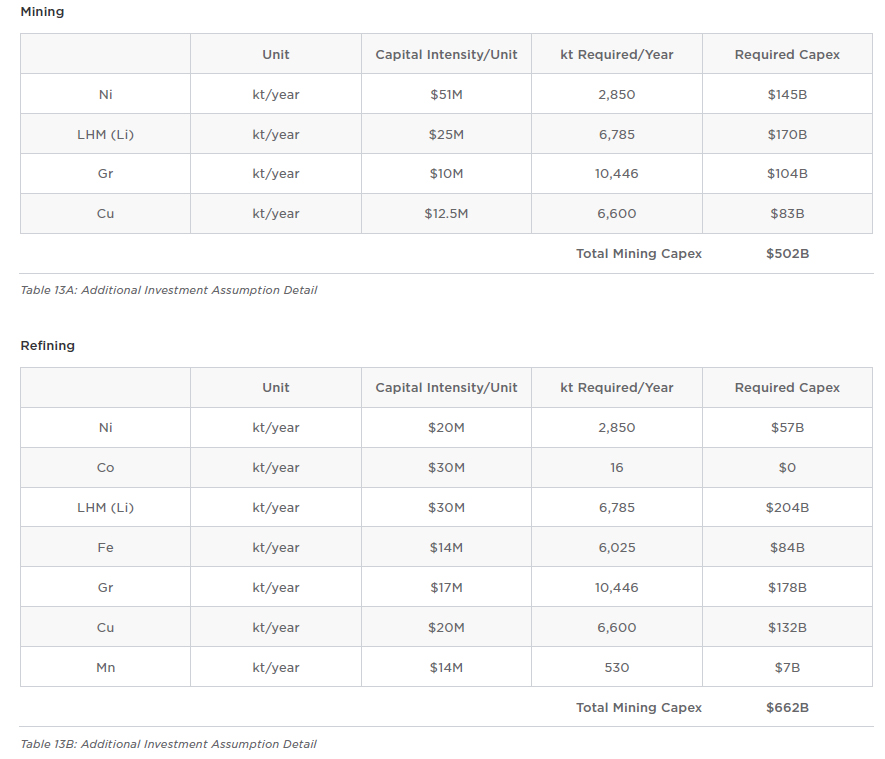
accordinglybb. Materials that require significant capacity growth are:
For mining: nickel, lithium, graphite and copper.
For refining: nickel, lithium, graphite, cobalt,
copper, battery grade iron and manganese.
In addition to initial capex, 5%/year maintenance
capex with a 20-year horizon is included in the investment estimate.
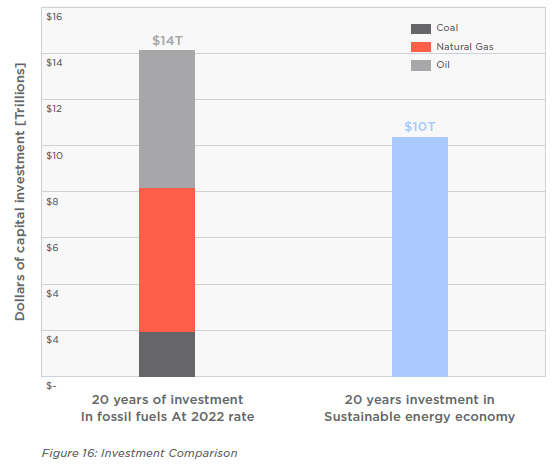
Using
these assumptions, building the manufacturing infrastructure for the
sustainable energy economy will cost $10 trillioncc, as
compared to the $14 trillion projected 20-year spend on fossil
fuels at the 2022 investment rate 52.
A Sustainable Energy Economy is 60% the Cost
of Continuing Fossil Fuel Investments
bb For example, if 46 TWh of stationary LFP battery
storage is required, and the life of a battery is 20 years, then the
manufacturing capacity is sized to 2.3 TWh/year
cc In-scope manufacturing capacity investments: wind turbines, solar
panels, battery cells, upstream battery inputs, mining, refining,
electric vehicles, heat pumps, and
electrolyzers, carbon capture, and Fischer Tropsch. Salt cavern
hydrogen storage is also included
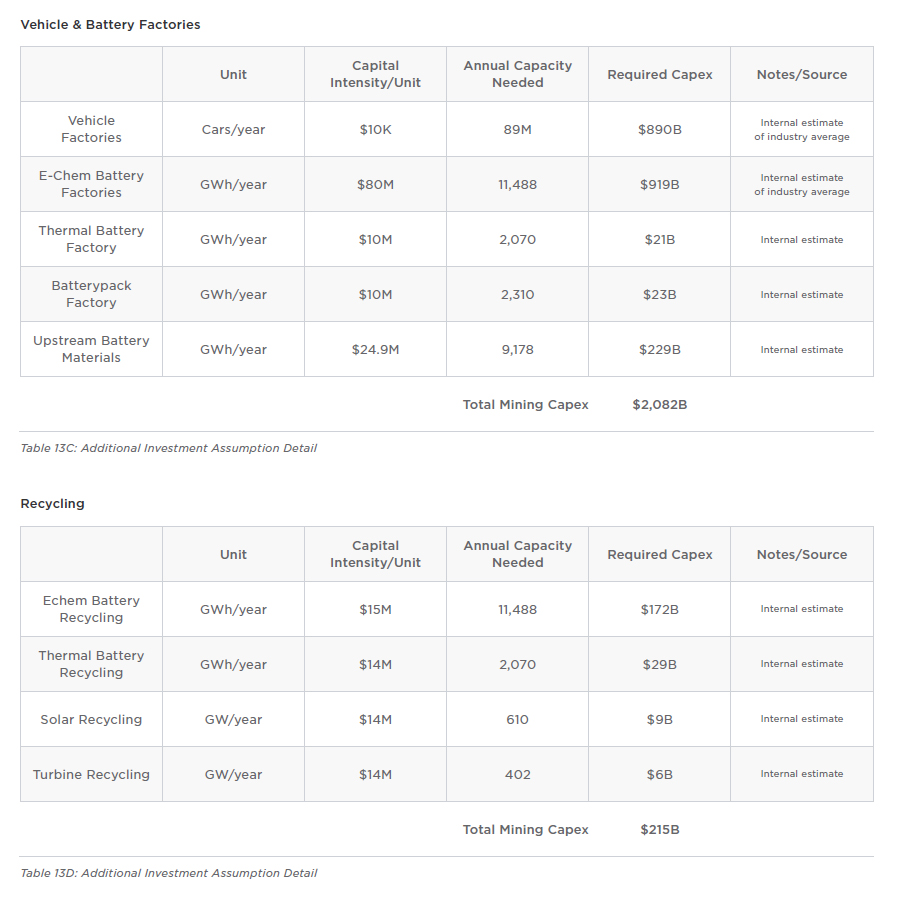
Investment Required
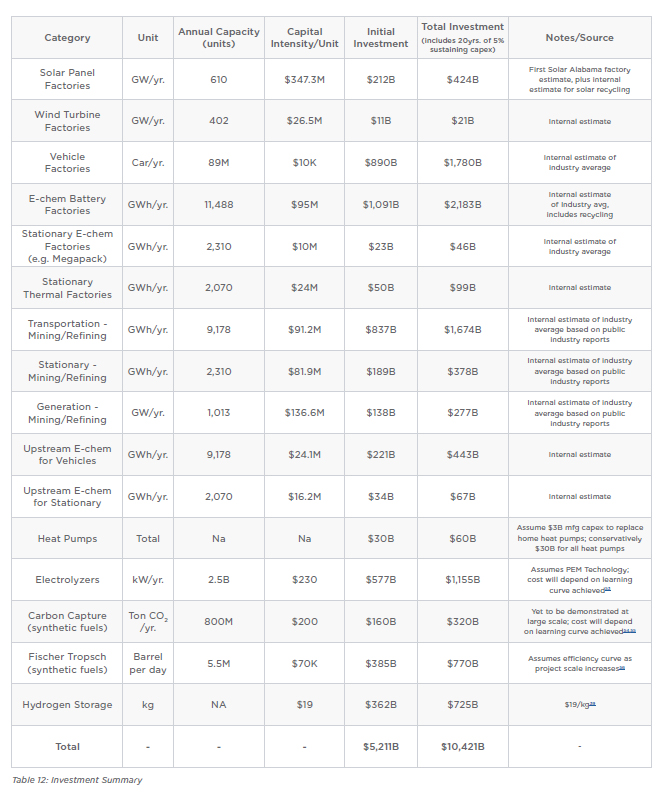
Table 13 Provides additional detail into mining,
refining, vehicle factories, battery factories and recycling
assumptions. Mining and
refining assumptions are an internal estimate of industry average
based on public industry reports:

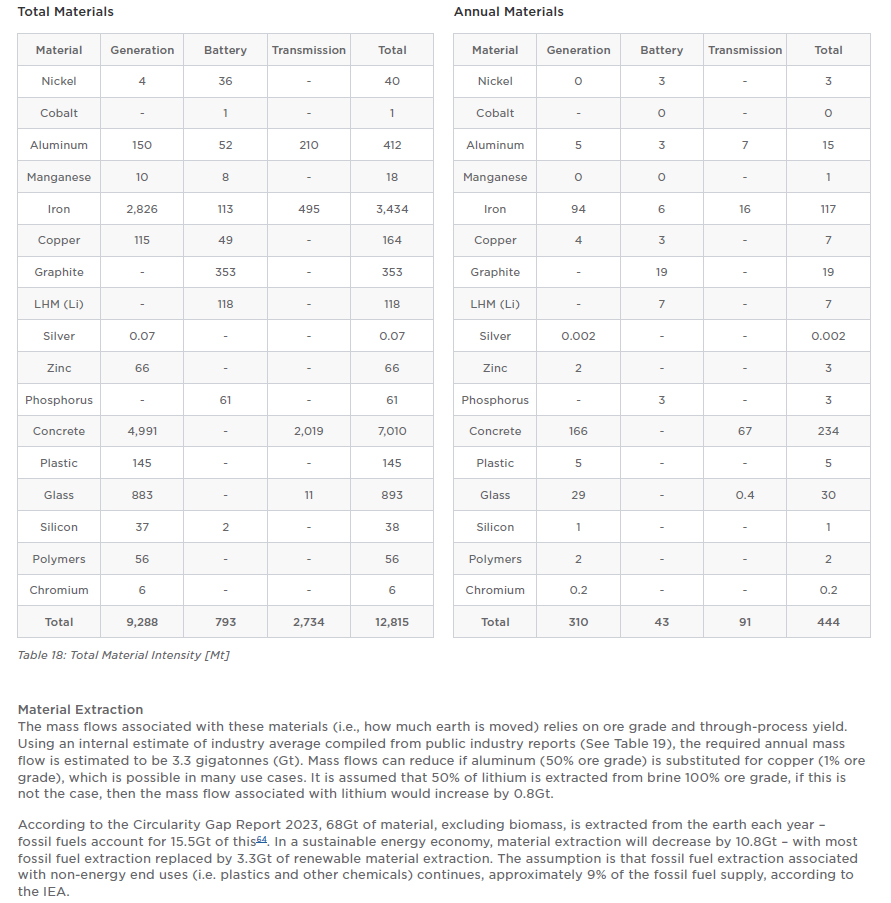
Materials Required
Assumptions
The total materials required for solar panels, wind turbines, and
circuit miles miles are calculated based on third party material
intensity assumptions. Battery material intensity is based on
internal estimates. Solar panel and wind turbine material intensity
assumptions are from a European Commission report. Solar cells
are wafer-based crystalline silicon, and rare earth minerals are
eliminated from wind turbines, given the progress demonstrated
in developing technologies59.
Based on IEA’s 2050 Net Zero pathways study,
approximately 60 million circuit miles will need to be added or
reconductored globally to achieve a fully
sustainable, electrified global economy. Distribution capacity will
primarily be expanded by reconductoring
existing lines and expanding substation capacity that can accommodate
significant growth in peak and average
end-user demand. High-voltage transmission will primarily expand
geographic coverage to connect large wind and solar
generation capacity to densely populated areas. For purposes of
estimating material requirements, 90% of the 60 million circuit
miles will be reconductoring of existing low-voltage
distribution systems and 10% will be new circuit-miles from
high-voltage transmission, which is the
current ratio of US circuit miles between high-voltage transmission
and low-voltage distribution 60,61.

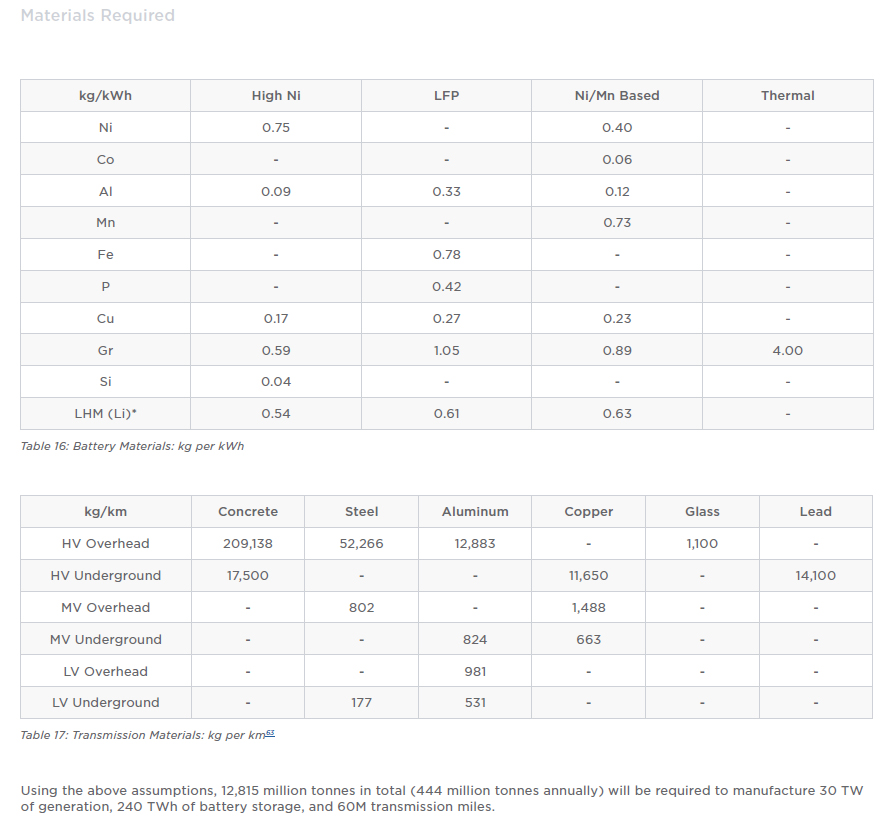
* LHM is equivalent to LiOH-H2O and has approximately 6x the mass
as the Lithium alone

dd Assume 50% of the Lithium was extracted from brine. 100% ore
mined for that portion of Lithium supply
Materials Required


ee Including 8 TWh of stationary electricity storage, excluding h2
storage.

ff Energy intensity of graphite is used as a proxy for
thermal batteries
gg Internal estimate
https://www.iea.org/data-and-statistics/data-product/world-energy-balances
https://flowcharts.llnl.gov/
http://www.departmentof.energy/
https://www.eia.gov/electricity/gridmonitor/dashboard/electric_overview/US48/US48
https://afdc.energy.gov/data/10310
https://www.fueleconomy.gov/feg/noframes/45011.shtml
https://www.fueleconomy.gov/feg/bymodel/2022_Toyota_Corolla.shtml
https://www.eia.gov/opendata/browser/
https://iea.blob.core.windows.net/assets/4713780d-c0ae-4686-8c9b-29e782452695/TheFutureofHeatPumps.pdf
https://www.iea.org/reports/the-future-of-heat-pumps/how-a-heat-pump-works
https://www.sciencedirect.com/science/article/pii/S1364032116309418
https://www.energy.gov/energysaver/furnaces-and-boilers
https://www.iea.org/commentaries/clean-and-efficient-heat-for-industry
https://backend.orbit.dtu.dk/ws/portalfiles/portal/149827036/Contribution_1380_final.pdf
https://backend.orbit.dtu.dk/ws/portalfiles/portal/151965635/MAIN_Final.pdf
https://www.iea.org/data-and-statistics/charts/industrial-heat-demand-by-temperature-range-2018
https://www.sandia.gov/ess-ssl/wp-content/uploads/2020/12/ESHB_Ch12_Thermal_Ho.pdf
https://medium.com/antora-energy/turning-sunshine-and-wind-into-24-7-industrial-heat-and-power-cheaper-than-fossil-fuels-69355cdcde04
https://www.bostonmetal.com/green-steel-solution/
https://www.iea.org/reports/hydrogen
https://www.ncbi.nlm.nih.gov/pmc/articles/PMC7712718/
https://agupubs.onlinelibrary.wiley.com/doi/full/10.1029/2022GL101420
https://www.sciencedirect.com/science/article/abs/pii/S0360319920331426
https://www.iea.org/data-and-statistics/charts/natural-gas-consumption-for-non-energy-use-by-application-2019-2025
https://www.nature.com/articles/s41560-022-01065-y
https://pubs.acs.org/doi/10.1021/acsenergylett.9b02574
https://www.energy.gov/eere/bioenergy/articles/sustainable-aviation-fuel-review-technical-pathways-report
https://www.iea.org/reports/direct-air-capture
https://iopscience.iop.org/article/10.1088/2516-1083/abf1ce
https://www.serc1.org/docs/default-source/committee/resource-adequacy-working-group/2020-serc-probabilistic-assessment-report-redacted.
pdf?sfvrsn=58904e0c_2
https://www.wecc.org/Reliability/TAS_PathReports_Combined_FINAL.pdf
https://www.ercot.com/files/docs/2020/07/30/ERCOT_DC_Tie_Operations_Document.docx
https://netzeroamerica.princeton.edu/img/NZA%20Annex%20A3%20-%20Inputs%20catalog%20for%20EER%20modeling.xlsx
https://www.ref.org.uk/ref-blog/371-constraint-payments-to-wind-power-in-2020-and-2021
http://www.caiso.com/Documents/ProductionAndCurtailmentsData_2022.xlsx
https://www.nrel.gov/gis/psh-supply-curves.html
https://agupubs.onlinelibrary.wiley.com/doi/10.1029/2022WR032210?af=R
https://energy.mit.edu/wp-content/uploads/2022/05/The-Future-of-Energy-Storage.pdf
https://www.osti.gov/pages/biblio/1840539#:~:text=Unlike%20underground%20pipes%2C%20the%20installed,3%2Fkg-H2
https://netzeroamerica.princeton.edu/the-report
https://www.eia.gov/outlooks/aeo/assumptions/pdf/table_8.2.pdf
https://www.nrel.gov/docs/fy12osti/51946.pdf
https://www.nrel.gov/wind/offshore-resource.html
https://atb.nrel.gov/electricity/2022/technologies
https://www.nrel.gov/docs/fy22osti/83650.pdf
https://www.energy.gov/eere/water/articles/hydropower-vision-report-full-report
https://www.nrel.gov/analysis/tech-cap-factor.html
https://www.nrel.gov/docs/fy18osti/70901.pdf
https://www.nrel.gov/docs/fy16osti/65938.pdf
https://www.greentechmedia.com/articles/read/the-us-has-145-gigawatts-of-untapped-commercial-solar-potential
https://www.energy.gov/sites/prod/files/2009%20Smart%20Grid%20System%20Report.pdf
https://www.iea.org/reports/world-energy-investment-2022/overview-and-key-findings
https://www.nrel.gov/docs/fy19osti/72740.pdf
https://iea.blob.core.windows.net/assets/78633715-15c0-44e1-81df-41123c556d57/DirectAirCapture_Akeytechnologyfornetzero.pdf
https://carbonengineering.com/wp-content/uploads/2019/11/APS_DAC_Report-FINAL_Original.pdf
https://www.researchgate.net/publication/271200536_Establishing_a_European_renewable_jet_fuel_supply_chain_the_technoeconomic_potential_of_biomass_
conversion_technologies
https://emp.lbl.gov/publications/land-requirements-utility-scale-pv
https://www.nrel.gov/docs/fy09osti/45834.pdf
https://www.energy.gov/eere/articles/advanced-wind-turbine-drivetrain-trends-and-opportunities
https://www.iea.org/data-and-statistics/data-product/net-zero-by-2050-scenario#
https://www.energy.gov/sites/default/files/2022-05/Next%20Generation%20Grid%20Technologies%20Report%20051222.pdf
https://eitrawmaterials.eu/wp-content/uploads/2020/04/rms_for_wind_and_solar_published_v2.pdf
https://www.sciencedirect.com/science/article/pii/S0921344920305176?via%3Dihub
https://www.circularity-gap.world/2023#download
https://www.fraunhofer.de/en/press/research-news/2022/september-2022/out-with-the-silver-in-with-the-copper-a-new-boost-for-solar-cells.html
https://asbury.com/media/1225/syntheticgraphiteparti.pdf
https://www.opec.org/opec_web/en/data_graphs/330.htm
https://pubs.rsc.org/en/content/articlelanding/2020/gc/d0gc02286a
https://www.nature.com/articles/s41560-022-01129-z
https://www.vestas.com/content/dam/vestas-com/global/en/sustainability/reports-and-ratings/lcas/LCA%20of%20Electricity%20Production%20from%20an%20
onshore%20EnVentus%20V162-6.2.pdf.coredownload.inline.pdf
https://krichlab.physics.uottawa.ca/wp-content/uploads/2014/06/Peng2013_Review-LCA-EPBTGHG-SolarPV.pdf
https://static1.squarespace.com/static/6213f06671d00e605c9eea45/t/62ce206273cd8e10b634d6bb/1657675880422/
TOWARD%2BA%2BLIFE%2BCYCLE%2BINVENTORY%2BFOR%2BGRAPHITE%2BPRODUCTION_carbonscape.pdf
Green Play Ammonia™, Yielder® NFuel Energy.
Spokane, Washington. 99212
www.exactrix.com
509 995 1879 cell, Pacific.
exactrix@exactrix.com
|
