Department of Chemical
Engineering, The University of Melbourne, Parkville, Vic, 3010,
Australia
Jining Guo, Yuecheng
Zhang, Ali Zavabeti, Kaifei Chen, Yalou Guo, Guoping Hu & Gang
Kevin Li
Ganjiang Innovation Academy,
Chinese Academy of Sciences, Ganzhou, Jiangxi, 341000, China
Guoping Hu
Department of Chemical
Engineering, School of Engineering, The University of
Manchester, Manchester, M13 9PL, UK
Xiaolei Fan
Nottingham Ningbo China
Beacons of Excellence Research and Innovation Institute, 211
Xingguang Road, 315191, Ningbo, China
Xiaolei Fan
Contributions
G.L. conceived the idea. J.G.
and Y.Z. conducted the experiments. J.G., G.L., A.Z., and Y.Z.
analyzed the data. K.C. and Y.G. helped with characterizations.
J.G. led the draft of the manuscript with input from G.L., A.Z.,
X.F., G.H., and Y.Z. This project has been supervised by G.L., G.H.,
and X.F.
Green hydrogen produced by water
splitting using renewable energy is the most promising energy
carrier of the low-carbon economy. However, the geographic
mismatch between renewables distribution and freshwater
availability poses a significant challenge to its production.
Here, we demonstrate a method of direct hydrogen production from
the air, namely, in situ capture of freshwater from the atmosphere
using hygroscopic electrolyte and electrolysis powered by solar or
wind with a current density up to 574 mA cm−2. A
prototype of such has been established and operated for 12
consecutive days with a stable performance at a Faradaic
efficiency around 95%. This so-called direct air electrolysis (DAE)
module can work under a bone-dry environment with a relative
humidity of 4%, overcoming water supply issues and producing green
hydrogen sustainably with minimal impact to the environment. The
DAE modules can be easily scaled to provide hydrogen to remote,
(semi-) arid, and scattered areas.
Introduction
Hydrogen is the ultimate clean energy.
Despite being the most abundant element in the universe, hydrogen
exists on the earth mainly in compounds like water. H2
produced by water electrolysis using renewable energy, namely, the
green hydrogen, represents the most promising energy carrier of
the low-carbon economy1,2,3.
H2 can also be used as a medium of energy storage for
intermittent energies such as solar, wind, and tidal4,5,6.
The deployment of water electrolyzer is
geographically constrained by the availability of freshwater,
which, however, can be a scarce commodity. More than one-third of
the earths land surface is arid or semi-arid, supporting 20% of
the worlds population, where freshwater is extremely difficult to
access for daily life, let alone electrolysis7,8.
In the meanwhile, water scarcity has been exacerbated by
pollution, industrial consumption, and global warming.
Desalination may be used to facilitate water electrolysis in
coastal areas, however, substantially increasing the cost and
complexity of hydrogen production. On the other hand, areas rich
in renewable energies are commonly short in water supply9.
Figure 1a
and
1b shows a distinctive geographic match between the shortage
of freshwater and the potential of solar power and wind power,
respectively, in the majority of the continents, such as North
Africa, West, and Central Asia, Midwest Oceania, and southwest of
North America.
Click on image to enlarge
a water risk and solar energy
potential; b water risk and wind energy potential (excluding
coast areas). Separate maps are available in Supplementary Fig. 13.
Source: World Resources Institute (WRI) Aqueduct42,
accessed on [04.2021],
aqueduct.wri.org; World Bank Group43,
accessed on [04.2021],
https://globalsolaratlas.info; Technical University of Denmark44,
accessed on [04.2021],
https://globalwindatlas.infoCreative Commons Attribution
International 4.0 License.
Few studies have been trying to mitigate
the water shortage for electrolysis. Direct saline splitting can
produce hydrogen, which, however, faces a serious challenge of
handling chlorine byproduct10,11.
Some proton/anion exchange membrane electrolyzers can use high
humidity vapor feed to the anode; however, the cathode of all of these
electrolyzers must operate in an air-free atmosphere12,13,14,15,16,17,18,19,20,
purged by an inert carrier gas such as nitrogen or argon, resulting in
particularly low H2 product purity of less than 2%. On
another note, photocatalytic water splitting has a potential to use
vapor feed21,
but the biggest problem of this method is its low solar-to-hydrogen
efficiency (around 1%) in real-world demonstrations22,23
and to make it more complicated, the product is a mixture of H2
and O2 gases which require an extra separation process.
In this work, we corroborate that
moisture in the air can directly be used for hydrogen production via
electrolysis, owing to its universal availability and natural
inexhaustibility24,25,26,27,28there
are 12.9 trillion tons of water in air at any moment which is in a
dynamic equilibrium with the aqua-sphere29.
For example, even in the Sahel desert, the average relative humidity (R.H.)
is about 20%19,
and the average daytime R.H. at Uluru (Ayers Rock) in the central
desert of Australia is 21%30.
Considering deliquescent materials such as potassium hydroxide,
sulfuric acid, propylene glycol31,32
can absorb water vapor from a bone-dry air, here, we demonstrate a
method to produce high purity hydrogen by electrolyzing in situ
hygroscopic electrolyte exposed to air. The electrolyzer operates
steadily under a wide range of R.H., as low as 4%, while producing
high purity hydrogen with a Faradaic efficiency around 95% for more
than 12 consecutive days, without any input of liquid water. A
solar-driven prototype with five parallel electrolyzers has been
devised to work in the open air, achieving an average hydrogen
generation rate of 745 L H2 day−1 m−2
cathode; and a wind-driven prototype has also been demonstrated for H2
production from the air. This work opens up a sustainable pathway to
produce green hydrogen without consuming liquid water.
Results
Design of the Direct Air
Electrolysis (DAE) module for hydrogen production
Hydrogen production from the air was
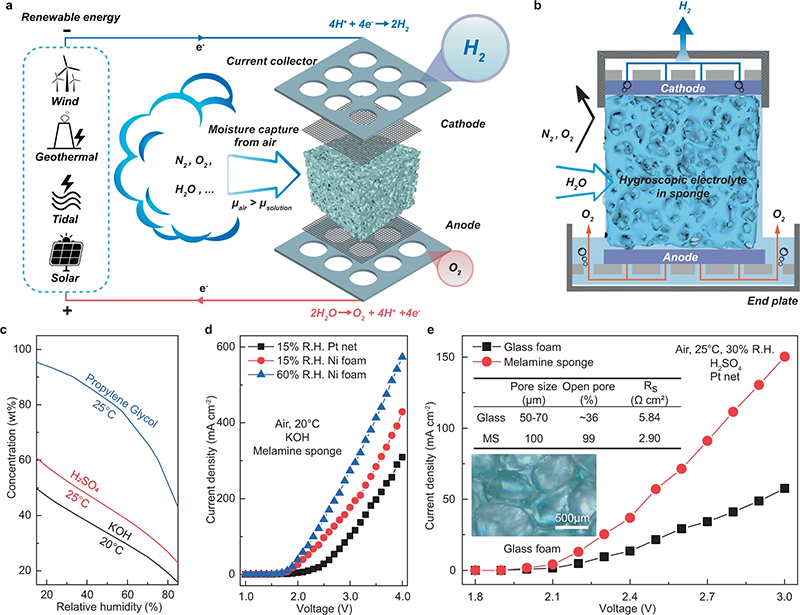
realized through our DAE module. As shown in the sandwich structure
in Fig.2a,
b, this module consists of a water harvesting unit in the middle
and electrodes on both sides paired with gas collectors. The module
is integrated with a power supply, for example, a solar panel, a
wind turbine, and any other renewable generators. Importantly, the
water harvesting unit also serves as the reservoir to hold the
electrolyte. Porous medium such as melamine sponge, sintered glass
foam is soaked with deliquescent ionic substance to absorb moisture
from the air via the exposed surfaces. The captured water in the
liquid phase is transferred to the surfaces of the electrodes via
diffusion and subsequently split into hydrogen and oxygen in situ
which are collected separately as a pure gas, since both electrodes
are isolated from air (Supplementary Figs. 46).
The reservoir between the endplate and the porous foam
(Supplementary Fig. 5b)
works as an air barrier and a buffer for the volume of the ionic
solution at excessive fluctuation of the air humidity. This
reservoir avoids the overflow of the electrolyte from the DAE module
or the dry-up of the wetted foam. When glass foam is chosen as the
porous media, quartz wool is tightly packed in between the foam and
the electrodes to ensure the connectivity of the aqueous phase
(Supplementary Fig. 7).
The porous media also ensure the free movement of the electrolyte in
the capillary of the foam (Supplementary Fig. 8,
Supplementary Movie 1).
The foam filled with ionic solutions forms a physical barrier that
effectively isolates hydrogen, oxygen, and air from any mixing.
Click on image to enlarge
a A schematic diagram of the DAE
module with a water harvesting unit made of porous medium soaked with
the hygroscopic ionic solution. b A schematic diagram of the
cross-section of the DAE module, showing the electrodes are isolated
from the air feed, and the absorbed water are transported to the
electrode by capillaries of the sponge. c Equilibrium water
uptakes of hygroscopic solutions at different air R.H.31,32.
d JV curves for DAE modules using Pt or Ni electrodes
sandwiched with KOH electrolyte (in equilibrium with 15% and 60% R.H.
at 20 ¯C) soaked in a melamine sponge. e Effect of sponge
materials on J-V performance of DAE modules using H2SO4
electrolyte in equilibrium with 30% R.H. at 25 ¯C. The inset shows the
optical micro image for the glass foam. Source data are provided as a
Source Data file.
Hygroscopic substances characterized with
a strong affinity with water tend to extract moisture from the
atmosphere at exposure, absorbing sufficient water to form an aqueous
solution which is hygroscopic in nature. When the chemical potential
(μ) of water vapor in the atmosphere is greater than that in a
hygroscopic solution, i.e., μair > μsolution,
the solution will continue absorbing water vapor and being diluted
until the vapor-liquid equilibrium is reached at μair = μsolution33,
making the concentration of the solution C equal to the equilibrium
one C* (Fig.2c).
In this study, we tested several hygroscopic materials, including CH3COOK,
KOH, and H2SO4, representing a salt, a base, and
an acid, respectively. All three materials spontaneously absorb
moisture from the air and form ionic electrolytes. It was found that
the direct air electrolysis modules using the respective electrolytes
were able to produce hydrogen gases successfully for an extended
period with a continual supply of air and power. For CH3COOK
based DAE module, the voltage was as high as 3.70 V due to the large
size of acetate anions and substantial CO2 and ethane
byproducts found along with O2 at the anode (Supplementary
Fig. 9).
Importantly, the DAE module using Ni
electrode (Supplementary Fig. 10)
and KOH electrolyte with moisture supplied by 60% R.H. air achieved a
high current density of 273 mA cm−2 at 3.0 V and 574 mA cm−2
at 4.0 V, or 177 mA cm−2 at 3.0 V and 15% R.H. (Fig. 2d).
However, the performance of this DAE module started to decline after
72 hr and we had to stop it at 96 h. This was because the voltage of
the DAE module increased from 2.3 V to 2.4 V due to the gradual
conversion of KOH into K2CO3 and eventually KHCO3
at exposure to the 420 ppm level CO2 in the air. KHCO3
is less soluble in water hence less conductive as an electrolyte, and
critically it is non-deliquescent, unable to absorb moisture from the
air. We believe if the CO2 in the feed air can be rejected
by a barrier, KOH would stay as a top choice for the DAE module.
Sulfuric acid has been identified as one
of the best hygroscopic materials that can absorb moisture from the
air down to relative humidity 5% or below31,34.
Meanwhile, the sulfuric acid solutions are high in conductivity
(0.61 S cm−1 at 50.0 wt%)35,36,
non-volatile, and it is non-toxic to the environment. It was found the
current density of the DAE using H2SO4 soaked
melamine sponge could also reach 150 mA cm−2, 2.5 times
higher than that using sintered glass foam, because the series
resistance of the former was 50% lower owning to its high open-pore
fraction (Fig.2e).
However, the melamine sponge gradually degrades in the H2SO4
solution after a week. In this regard, the following studies were
carried out using sulfuric acid electrolyte equipped with glass foams
and platinum (Pt) mesh electrodes (Supplementary Fig. 11)
for long-term stability and CO2 resistance. It is also
interesting to note that in the concentration range of sulfuric acid
of this work, the corresponding freezing point of the electrolyte is
below −30 ¯C37,
implying potential working temperature under an icing environment.
Performance of the DAE module
The DAE modules performance was
investigated using current density (J) and voltage (V) characteristic
experiments conducted at 25 ¯C. The effect of relative humidity
ranging from 20% to 80%, as well as the pore size and thickness of the
sintered glass foams, were studied. Sintered glass foams were labelled
as G1, G2, and G3 corresponding to the pore size of 50−70, 30 − 50,
16−30 çm, respectively. Also, a series of experiments with extended
time durations of 288 h was conducted to investigate the stability of
the DAE module.
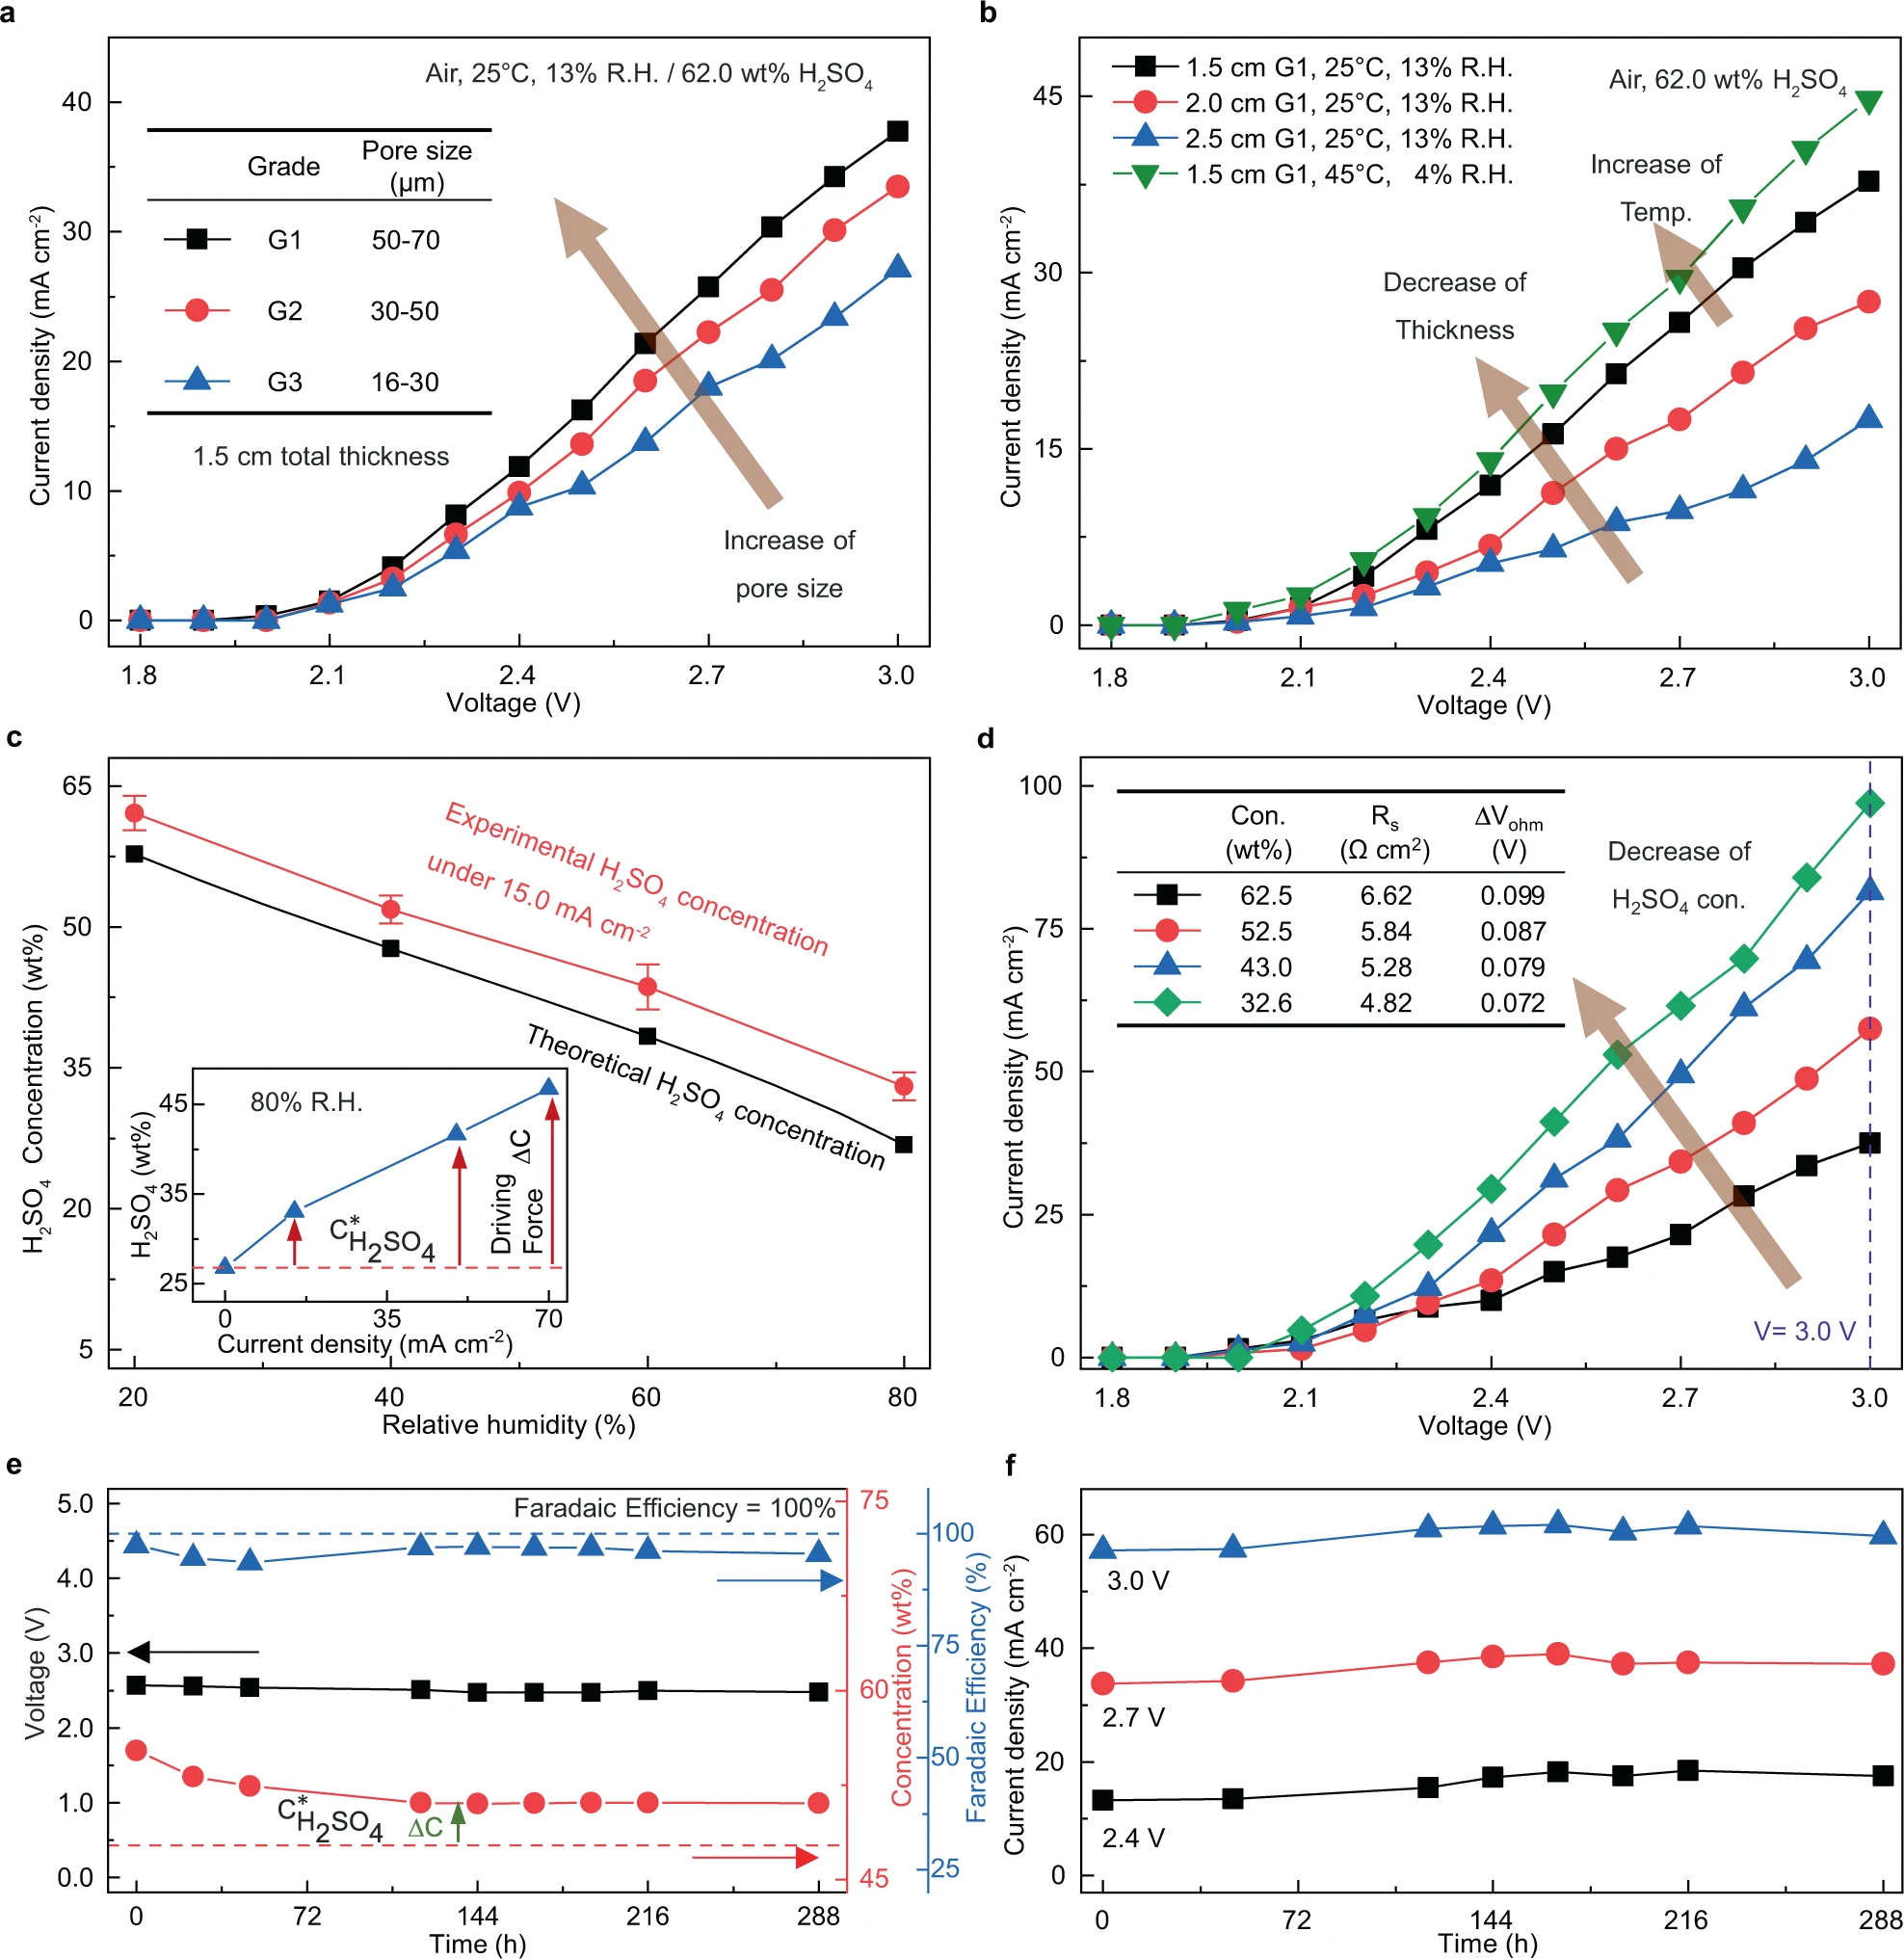
The effect of the different pore sizes of
sintered glass foams on the J-V behavior is shown in Fig.3a,
using 62.0 wt% H2SO4 solution as electrolytes.
Current density is negligible (<1 mA cm−2) at a voltage
below 2.0 V due to the overpotential of the Pt mesh. As long as the
capillary force still holds the electrolyte, the current density
increases with the use of larger pored sintered glass foams,
indicating higher conductivity and energy efficiency for overall water
splitting due to better mobility of electrolyte in larger pores. At
3.0 V, a current density of 27.1 mA cm−2 was achieved using
G3 sintered glass foam and it increased to 37.8 mA cm−2
using G1 sintered glass foam. Therefore, the G1 sintered glass foam
was chosen for further study of the foam thickness, owning to the high
electrical conductivity, low resistance, and high energy efficiency it
brings to the DAE module.
Click on image to enlarge
a JV curves for modules using
various porous substrate with different pore sizes. b Effect of
temperature and foam thickness on J-V performance. c The
experimental steady state concentration of sulfuric acid at J = 15.0 mA cm−2
(red) VS equilibrium concentration
∗
(black) under different R.H. Error bars represent standard deviation,
n = 3 independent replicates. The inset shows the effect of current
density on steady state concentration under 80% R.H. where
∗ = 26.8 wt%
(red dashed line). d The effect of electrolyte concentration on
JV performance. e Example recording of cell voltage (black
symbol), H2SO4 concentration (red symbol),C∗
= 47.7 wt% (red dashed line), Faradaic
efficiency (blue symbol) for DAE modules at constant current
density of 15.0 mA cm−2 for 288 h at 40% R.H. f
Current density collected under different voltage for 288 h at 40%
R.H. Figures 3c to 3f were operated with G1 sintered glass foam
and 1.5 cm gap between the two electrodes. Source data are
provided as a Source Data file.
The operation temperature and sintered
glass foams thickness also plays a role in the J-V behavior. As shown
in Fig.3b,
with the increase of temperature from 25 ¯C to 45 ¯C, the current
density for the DAE module increased from 37.8 mA cm−2 to
44.8 mA cm−2, under a constant voltage of 3.0 V. This can
be attributed to the improved ion conductivity of H2SO4
with elevating the temperature35.
In the meantime, the J-V curve shifts upwards with decreasing glass
foam thickness at 25 ¯C. At 3.0 V, the current densities are 17.5 and
37.8 mA cm−2 while using 2.5 and 1.5 cm thickness G1
sintered glass foams, respectively. According to Pouillets law38,
the resistance is proportional to the distance between the electrodes,
suggesting that a large distance between the cathode and anode
contributed to high resistance for overall water splitting. Hence,
under specific current density, the gap between two electrodes should
be as small as possible to maintain relatively high energy efficiency.
However, the mass transfer area for water absorption is proportional
to the sintered glass foams thickness. There is a trade-off between
the water absorption area and conductivity. Considering both factors,
we chose the G1 sintered glass foam with 1.5 cm total thickness for
further investigation, given that it could provide sufficient mass
transfer area for air-electrolyte contact while maintaining moderate
energy efficiency.
The observed experimental concentration
of sulfuric acid C is constantly above its equilibrium concentration
C* during the direct air electrolysis process. This difference
represents the driving force for the mass transfer of water from the
vapor phase into electrolyte solution and then onto the
electrochemical reaction sites at the electrodes. Figure
3c shows that at J = 15.0 mA cm−2, the experimental
concentration in the DAE module is approximately 5 wt% higher than the
equilibrium at steady state, which means a stable in situ H2SO4
concentration over 8 h under a constant current density, where the
rate of water absorption from air equals the rate of water consumption
by electrolysis. Likewise, such steady-state mass transfer driving
force can be established at fixed air relative humidity. As shown in
Fig.
3c inset, the driving force increases proportionally with the
increase of current density, which means the rate of water absorbed by
the DAE module rises when the water electrolysis rate is turned up.
For instance, at R.H. = 80%, if a minimal current density is applied,
the sulfuric acid concentration in the module is close to the
equilibrium
C∗H2SO4
= 26.8 wt%, and the mass transfer
driving force of water absorption is nearly zero. If we increase the
current density J to 70 mA cm−2, the steady-state
concentration of sulfuric acid is increased to 46.7 wt%, 75% higher
than the equilibrium one
C∗H2SO4
= 26.8 wt%. Therefore, our DAE module is
intrinsically self-converged, compatible with a broad range of air
humidity and current density.
The DAE modules J-V behavior has also
been studied under different H2SO4
concentrations (Fig.3d).
With the decrease of H2SO4 concentration from
62.5 wt% to 32.6 wt%, the series resistance of the system decreases
from 6.62 Ω cm2 to 4.82 Ω cm2, while the current
density for the electrolysis reaction increases significantly from
37.5 mA cm−2 to 97.0 mA cm−2, under a constant
voltage of 3.0 V (the iR-corrected J-V curve is shown in Supplementary
Fig. 12).
Such change can be attributed to the improved electrical conductivity
of diluted H2SO4 (Supplementary Fig. 13)35,36.
Also, the viscosity of the electrolyte decreases as the acid is being
diluted (Supplementary Fig. 14),
resulting in higher electrocatalytic activity and reduced
electrochemical polarization39,40.
It is worth comparing the DAE using H2SO4@sintered
glass with that of KOH@melamine sponge, the latter has a system series
resistance of 2.93 Ω cm2, only 0.20 Ω cm2 higher
than an electrolyzer using direct KOH solution i.e., foam free
electrolyzer (Supplementary Fig. 15).
Such a low series resistance is responsible for the high current
density of 574 mA cm−2 achieved by the DAE module using KOH@melamine
sponge at 4.0 V as mentioned earlier.
The DAE module was found stable during
continual electrolysis. Performance of the electrolysis cell at
various voltage, energy efficiency, and air R.H. are shown in
Supplementary Table 1
and Supplementary Fig. 16.
After a minor fluctuation initially, the J-V behavior stabilize for a
48 h run. For further laboratory test, we chose 40% R.H. air as the
gas atmosphere condition. As shown in Fig.3e,
the concentration of H2SO4 fed to the module was
55.2 wt% initially, and it converged to 51.1 wt% over the first 120 h.
In the following 168 h, the electrolyte concentration, the DAE
modules voltage, the mass transfer driving force for moisture
absorption (ΔC = Cexp[51.1 wt%]C*[47.7 wt%] = 3.4 wt%)
and the H2 Faradaic efficiency (around 95%) are all
stabilized. Accordingly, the corresponding current densities collected
under specific voltages (2.4, 2.7, 3.0 V) also reached steady state in
this 12-day continual operation (Fig.3f).
This result indicates excellent adaptability and long-term stability
of the DAE modules under different air R.H., cell voltage, and
electrolyte concentrations.
Demonstration of DAE modules stack
with solar panel in the open air
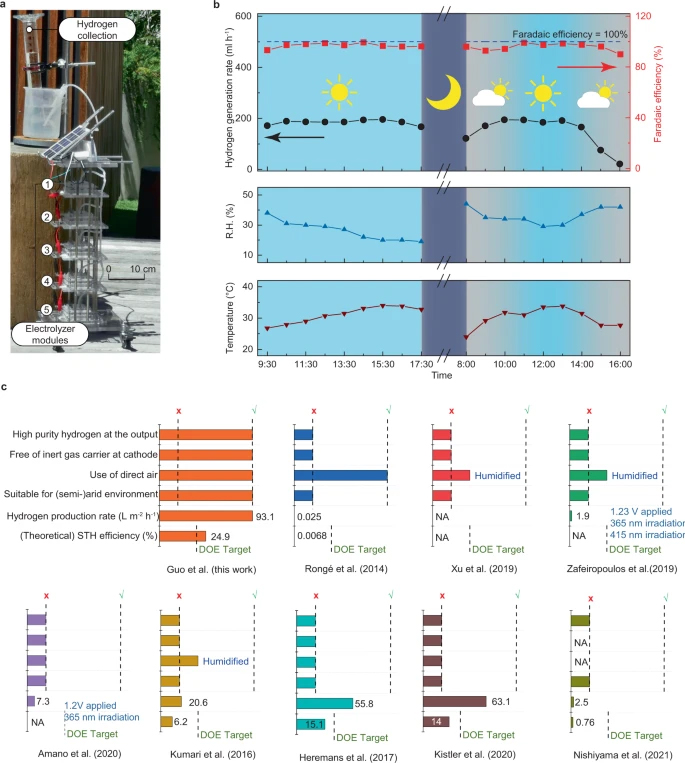
To further demonstrate the DAE modules
working capability in a practical environment, we designed and
constructed a free-standing hydrogen generation tower consisting of
five DAE modules stacked in parallel superimposed vertically with a
solar panel for power supply. The details of the structure of the
tower are shown in Fig.4a
and Supplementary Fig. 17.
One of the advantages of such design is that the footprint of the
tower is no more than the solar panel, meaning our DAE will not occupy
extra land, which can be costly in some areas. The tower was tested
for two days, 8 h per day, in the open air of a hot-dry summer
(Mediterranean climate) in the campus of the University of Melbourne.
The setup of the module of the outdoor surroundings is provided in
Supplementary Movie 2.
The outdoor temperature varied from 20 ¯C to 40 ¯C, and the relative
humidity ranged from 20% to 40% over the testing period. Since the
solar panel was used as a renewable energy supply, the voltage, and
the current of each DAE module were solely determined by solar
intensity (Supplementary Movie 3),
which varies every hour. The product hydrogen gas evolved from the
cathode was collected in an inverted, water-filled cylinder over
water, which was then used to examine the gas production rate
(Supplementary Movie 4).
The oxygen generated on the anode of the DAE was vented into the air.
The performance of the tower was shown in
Fig.4b
and Supplementary Fig. 18,
in the form of the hydrogen generation rate, hydrogen evolution
Faradaic efficiency (ηf,H2),
the overall current, and the voltage. During the open-air
demonstration,
ηf,H2
was at an average of 95% during the
daytime, shown as the red line in Fig.4b.
On the first day, when the weather was sunny, the current output was
stable around 400 mA, and voltage 2.68 V. The hydrogen evolution rate
was 186 ml h−1, with the total hydrogen production at
1490 ml in a day, which is equivalent to 745 L H2 day−1 m−2
of the cathode, or 3.7 m3 H2 day−1 (m2
tower)−1.
On the second day, a few hours of good
sunlight guaranteed the current output stable at 400 mA from 9:00 to
13:00, with an average hydrogen generation rate of about 179 ml h−1,
similar to that of the first day. However, in the early morning from
8:00 to 9:00, the solar intensity was limited, resulting in a
relatively lower current output of 270370 mA and a hydrogen
generation rate of 140 ml h−1. In the cloudy late afternoon
(14:00 to 16:00), the poor weather conditions reduced the solar
panels current output to as low as 50 mA, and hence, the hydrogen
generation rate dropped to 21 ml h−1. On the whole, under
non-ideal weather conditions, the total hydrogen production could
still reach 1188 ml on the second day.
The gas product collected from the
cathode has been analyzed with gas chromatography (GC.), suggesting
pure hydrogen (>99%) (Supplementary Fig. 19).
The gas produced from the anode has also been measured (Supplementary
Fig. 20)
with a GC. showing it is a high-purity oxygen (>99%) (Supplementary
Fig. 21).
The Faradaic efficiency of oxygen
ηf,O2
at the anode is over 91.0%. Since the
Faradaic efficiency of both H2 and O2
measured and calculated by energy and mass balances are
comparable, we again confirm the overall electrolysis is a
water-splitting process. After keeping the above DAE module
unattended in air for 8 months, the Faradaic efficiency of
hydrogen remains around 90%, without any maintenance.
We compared the DAE modules against the
top-performing solar-driven water/vapor splitting by others. The
top criterion is the ability to produce high-purity hydrogen. As
shown in Fig.4c,
apart from our work, the existing electrolyzers using vapor feed
or photocatalytic water splitting have not been able to deliver
>99% purity hydrogen at the cathode output with their current
process setup. Normally, vapor-fed electrolyzer can only produce H2
with no more than 2% purity14,15,16,17,18,
e.g., works by Kumari et al17,
and Kistler et al18;
whereas photocatalysts produce a mixture of H2/O2.
It must be emphasized that all the literature using vapor feed (at
the anode) need inert carrier gases (N2 or Ar) at the
cathode which explains why their product H2 purity was
so low. Frequently, for those using vapor feed to the anode,
artificial humidification has been employed to boost the humidity
of the feed to above 60%14,15,16,17,18,19,20,
making them unsuitable for (semi-)arid environment. Also, the
hydrogen production rates in the existing vapor-fed electrolyzers
are mostly lower than 65 L m−2 h−1, while
our DAE prototype can reach 93.1 L m−2 h−1
in the outdoor test (Fig.4c).
In comparison, our DAE module is the only one that ticks all the
above boxes, plus a demonstrated 8 months long term stability
to-date, and a hydrogen production rate substantially (from a few
times to a few orders of magnitude) higher than literature works
in the same domain14,15,16,17,18,19,22.
Very importantly, to the best of our knowledge, our DAE could be
the first technology exceeding the target of 20% solar-to-hydrogen
(STH) energy efficiency set by the U.S. Department of Energy (DOE)41.
DAE coupled with a triple-junction solar panel can achieve a
theoretical STH efficiency of 15.7% under different H2SO4
concentration (Supplementary Fig. 22),
while coupling with the best performing solar panel using H2SO4
and KOH hygroscopic electrolyte can achieve a theoretical STH
efficiency of 24.9% and 32%, respectively (see Supplementary
Tables 1,
3 and
4 for more details).
Furthermore, the energy supply to our
DAE module is not limited to solar. In another demonstration
(Supplementary Fig. 23
and Supplementary Movie 5),
we coupled the DAE module with a wind turbine and successfully
produced high-purity hydrogen from the air feed.
Discussion
In summary, to overcome the water
shortage problem in the case of widespread deployment of hydrogen
production, we have demonstrated a method of producing high purity
hydrogen from the air by using hygroscopic electrolyte soaked in a
porous medium as the moisture absorbent. Our direct air
electrolysis (DAE) module can achieve exceptional performance
under specific conditions, such as operational at as low as 4%
relative humidity with H2SO4 hygroscopic
electrolyte, or more than 12 days continuous H2
generation at 40% relative humidity performing at a hydrogen
Faradaic efficiency around 95% without any decay or attendance;
while in the case of using KOH hygroscopic electrolyte and nickel
foam electrodes, the current density can reach 574 mA cm−2
at 4.0 V and 60% R.H., or 177 mA cm−2 at 3.0 V and 15%
R.H. This DAE module can be numbered up easily and integrated with
various renewable powers. In our demonstration, a prototype of
standalone hydrogen generation tower with five DAE modules stacked
in parallel superimposed vertically under a solar panel (with
minimum footprint) was constructed and tested outdoor in a hot-dry
summer. The prototype achieved automated steady hydrogen
production depending on the solar intensity under varying weather
conditions. On a warm sunny day, the hydrogen production rate can
reach 3.7 m3 H2 day−1 m−2
tower. The integration of the DAE with wind turbine was
demonstrated in this study as well. Such DAE farms hold the
potential for generating abundant hydrogen in arid and semi-arid
areas with negligible disrupt to the regional air humidity and
minimal impact to the environment (Supplementary Note 1).
Further improvement of the surface-to-volume ratio by engineering
channels or increasing the aspect ratios of the sponge material
will guarantee the rate of water uptake which is essential to the
upscaling of the DAE units.
Methods
DAE module fabrication
A self-designed DAE module was used
under each R.H. in this project. More details can be found in the
Supplementary document. Pt mesh electrodes (99.99% purity, made by
0.12 mm Pt wire, while the frame was 0.5 mm Pt wire, Yueci
technology Co.) or Ni Foam electrodes (1.6 mm thickness, Keshenghe
metal materials Co.) with geometric area 4 cm2 were
attached directly to the quartz wool (99.95% purity, 510 çm,
Xinhu Co.), and then connected with the sintered glass surfaces,
with geometric area 7.84 cm2 (Shundao sintered glass
foam Co.). The melamine sponge (Daiso Industries Co., Ltd.) could
replace the glass foam and the quartz wool, with the geometric
area 7.84 cm2. The sintered glass foams thickness was
3 mm, and quartz wool was layered between two foams. For example,
for 1.5 cm total thickness, three foams and four layers of quartz
wool were used stacked. Teflon plate with Pt wireline (99.99%
purity, Xudong Co., Ltd.) was used as current feeders and
electrolyte distributors. After assembly, the DAE module was put
inside the climate test chamber (DHT-100-40-P-SD, Shanghai Doaho
Co., Ltd.), keeping a close environment at a constant R.H. and
temperature. The DAE module connected directly with a D.C. power
supply (DPS3010U, Wanptek Co.), which could supply constant
current for electrolysis. The cathodes output gas production was
bubbled through a water bath, and collected in an inverted,
liquid-filled cylinder.
Data collection
Another DC power supply (Nice Power
R-SPS605D, ShenZhen Kuaiqu electronic Co., Ltd.) was used to
connect with the DAE module or foam-free electrolyzer to collect
the current density vs. voltage (JV) performance curve. The
foam-free electrolyzer was a 50 ml volume two-electrode cell, with
a 1.5 cm electrode distance. The current was measured after 30 s
under each voltage, using an applied voltage from 1.80 V to 3.00 V
(H2SO4) or 1.00 V to 4.00 V (KOH) with a
100 mV increase per 30 s. The area of the electrode was 4 cm2.
Under each R.H., the J-V behavior was tested before putting into
the environment oven and after operating over 24 h and 48 h. Each
J-V behavior was verified by repeated measurements three times,
with the current densities variation controlled within 510%.
Under each R.H., the DAE module was
operated under constant current density, and the weight needed to
be checked each 4 h until it maintained stable over an 8-hr
period. The electrolyte equilibrium concentration was calculated
by the weight changes of the DAE module before operation and after
steady state.
Electrochemical impedance
spectroscopy (EIS) measurements were employed at 0 V vs (OCP)
with the frequency range from 106 Hz to 10−1 Hz
and an AC signal of 10 mV in amplitude as the perturbation for
collecting the series resistance (CS350 Electrochemical
Workstation, Wuhan Corrtest Instrument Co., Ltd.).
In this paper, the iR-compensation
was calculated by the following equation:
were collected from the J-V curve, and Rs
(Ω cm2) was series resistance for each DAE module.
Faradaic efficiency
The gas product flowed into a measuring
cylinder (25.0 ml) through a rubber pipeline for volume measurement by
a collection of gases in an inverted, water-filled cylinder over
water. Gas collected inside the cylinder was drawn out by the syringe
and then pushed into the gas chromatography (GC.) system (7890B,
Agilent technologies, Inc.) with a thermal conductivity detector (TCD.)
for analyzation. The separation columns used in the GC were HP-INNOWAx,
HP-PLOT U, and CP-Molsieve 5 é Columns. The Faradaic efficiencies
ηf,H2
and
ηf,O2
were compared to the gas production with
the ideal production rate, which is calculated according to the
following equations:
and
rO2
were the rate of hydrogen production and oxygen generation rate
respectively, while
rH2,ideal
and
rO2,ideal
were the ideal rate of hydrogen
production and oxygen generation rate respectively. P0
was the standard atmospheric pressure (101,325 Pa), T was the
operating temperature (298.15 K), R was the gas constant (8.3145 m3 Pa K−1 mol−1),
F was Faradaic constant (96,485 C mol−1) and S was the
electrode area (4 cm2).
Materials characterization
The FlexSEM 1000 scanning electron
microscope (SEM, Hitachi Co., Ltd.) and Binocular microscope
BM-500T (Ruihong Co., Ltd.) were used for imaging the glass foam.
Stability test
55.2 wt% H2SO4
(formulated with 98% sulfuric acid and R.O. water) was used as the
electrolyte and tested under 40% R.H. and 25 ¯C in the climate
test chamber for 12 days under constant current density 15.0 mA cm−2.
Open air demonstration with solar panel
Five DAE modules were stacked
vertically in parallel, and the hydrogen generation was collected.
Supporters were used to keep the distance between each unit. Here,
a commercial silicon solar panel was connected in series and put
on the top of the units, with an open-circuit voltage of around
6.0 V and a short circuit current around 400 mA under Melbournes
natural sunlight. The gas product was also flowed into a measuring
cylinder by collecting gases in an inverted, water-filled cylinder
over water. Also, the gas product could be collected in an
inverted, oil-filled cylinder over oil.
Open air demonstration with wind turbine
Here, a commercial small wind turbine
was coupled with a single DAE module, with an open-circuit voltage
of around 8.0 V. However, short circuit current was very low (<1 mA).
The gas product could be bubbled in oil.
Okin, G. S., Gillette, D. A. &
Herrick, J. E. Multi-scale controls on and consequences of
aeolian processes in landscape change in arid and semi-arid
environments. J. Arid Environ.65, 253275
(2006).
Dresp, S., Dionigi, F., Klingenhof,
M. & Strasser, P. Direct electrolytic splitting of seawater:
opportunities and challenges. ACS Energy Lett.4,
933942 (2019).
Heremans, G., Bosserez, T.,
Martens, J. A. & RongÕ, J. Stability of vapor phase water
electrolysis cell with anion exchange membrane. Catal.
Today334, 243248 (2019).
Heremans, G. et al. Vapor-fed
solar hydrogen production exceeding 15% efficiency using
earth-abundant catalysts and anion exchange membrane.
Sustain. Energy Fuels1, 20612065 (2017).
Amano, F. et al. Vapor-fed
photoelectrolysis of water at 0.3 V using gas-diffusion
photoanodes of SrTiO3 layers. Sustain. Energy
Fuels4, 14431453 (2020).
Zafeiropoulos, G., Johnson, H.,
Kinge, S., van de Sanden, M. C. M. & Tsampas, M. N. Solar
hydrogen generation from ambient humidity using
functionalized porous photoanodes. ACS Appl. Mater.
Interfaces11, 4126741280 (2019).
Kumari, S., Turner White, R.,
Kumar, B. & Spurgeon, J. M. Solar hydrogen production from
seawater vapor electrolysis. Energy Environ. Sci.
9, 17251733 (2016).
Kistler, T. A., Um, M. Y. & Agbo,
P. Stable photoelectrochemical hydrogen evolution for 1000 h
at 14% efficiency in a monolithic vapor-fed device. J.
Electrochem. Soc.167, 066502 (2020).
RongÕ, J. et al. Air-based
photoelectrochemical cell capturing water molecules from
ambient air for hydrogen production. RSC Adv.4,
2928629290 (2014).
Daeneke, T. et al. Surface water
dependent properties of sulfur-rich molybdenum sulfides:
electrolyteless gas phase water splitting. ACS Nano11, 67826794 (2017).
Kim, J. H., Hansora, D., Sharma,
P., Jang, J.-W. & Lee, J. S. Toward practical solar hydrogen
productionan artificial photosynthetic leaf-to-farm
challenge. Chem. Soc. Rev.48, 19081971
(2019).
éberg, C., Sparr, E., Edler, K. J.
& Wennerstr—M, H K. Nonequilibrium phase transformations at
the air−liquid interface. Langmuir25,
1217712184 (2009).
Muller, T. L. Sulfuric acid and
sulfur trioxide. (John Wiley & Sons, Inc., 2000).
K—lbach, M., Rehfeld, K. & May, M.
M. Efficiency gains for thermally coupled solar hydrogen
production in extreme cold. Energy Environ. Sci.
14, 41104417 (2021).
J. G. is grateful for the
Melbourne-Manchester Graduate Research scholarship.
This work was performed in part at the
Materials Characterization and Fabrication Platform (MCFP) at the
University of Melbourne and the Victorian Node of the Australian
National Fabrication Facility (ANFF).